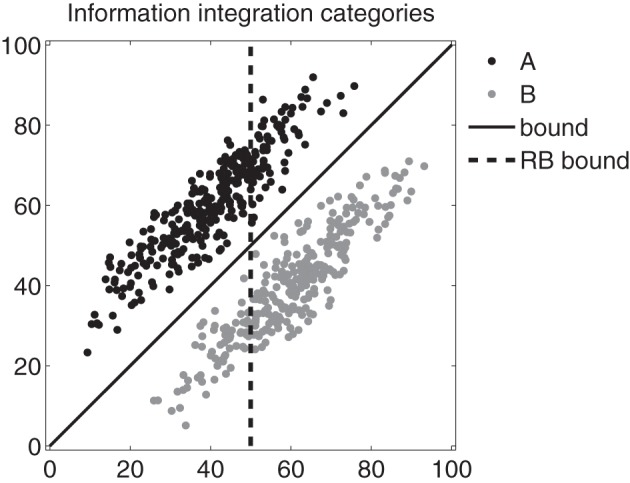
Figure 3.

Information integration (II) categories used in the simulation experiments. Each black and gray dot marks the 2D coordinates of a stimulus (e.g., disks varying in spatial frequency and orientation as in Figure 1). The solid black line represents the optimal boundary; the dashed black line represents a suboptimal rule-based boundary. Note that the axes are in arbitrary units.
