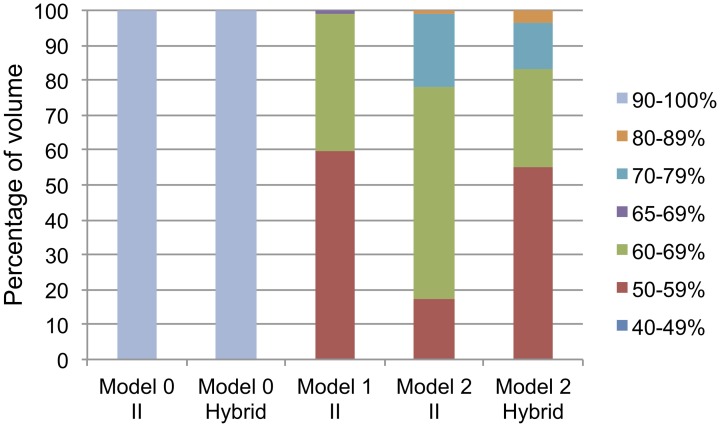
Figure 5.
Percentage of volume of the parameter space for each data pattern discovered for every model and category structure. The legend corresponds to test phase accuracy of the procedural system (i.e., possible data patterns). Each color represents a unique data pattern discovered by the PSP for that combination of model/category structure, and the height of the color in the bar corresponds to the volume of parameter space producing that data pattern. The range from 65 to 69% is a special pattern only searched for in model 1 (see text for details).

