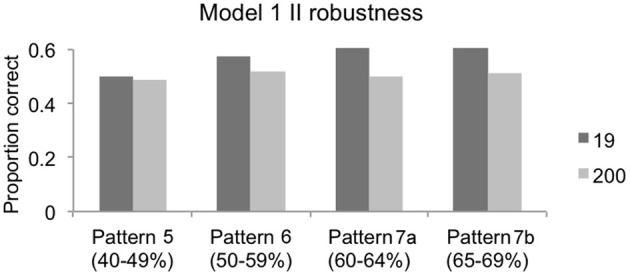
Figure 7.

Robustness of Model 1 (1FB-HS) in II categories for each of four discovered data patterns. Dark gray bars represent the performance of the model (proportion correct in the test phase) for the 19 fixed initializations used in the PSP analysis; light gray bars represent the performance of the model across 200 random initializations. In every case, the stage 2 analysis using 200 simulations failed to reproduce the patterns observed in the PSP across the 19 fixed initializations suggesting that the observed PSP performance was not robust. Note that the 60–69% performance decile was separated into two patterns (7a and 7b) for a more fine-grained evaluation.
