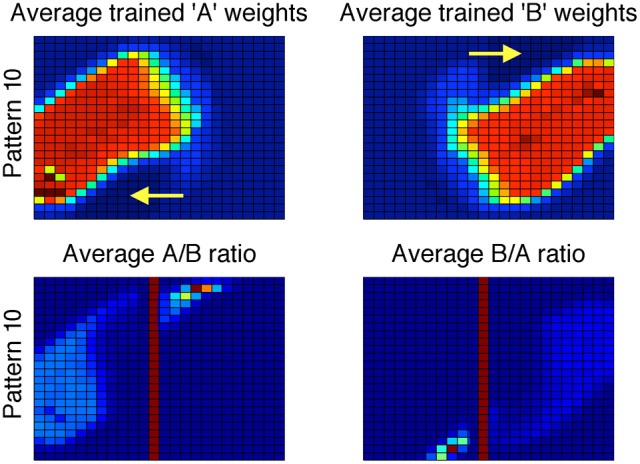
Figure 8.

Top: Striatal weights in the procedural system of Model 1 (1FB-HS-B) trained on II categories, averaged across 200 simulations. Blue (cool colors) represent small weights whereas red (warm colors) represent large weights. Note the qualitative difference between these weights and those in Figure 6. Bottom: Ratio of procedural system weights. Solid vertical line approximately corresponds to the explicit system rule-based bound. Note that large values in the ratio correspond to regions where the weights in the denominator are driven toward zero (darkest blue regions in the top row indicated by yellow arrows).
