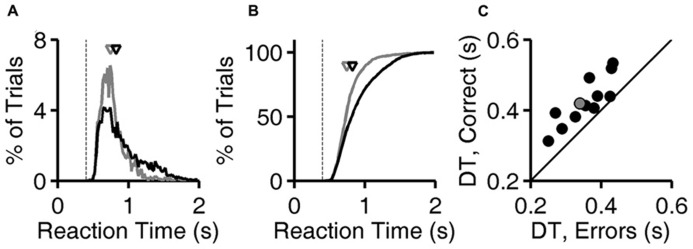
FIGURE 2.

Longer latencies in correct trials. (A) Distribution of reaction times for error trials (gray) and correct trials (black) for exemplar discriminations for one subject (same subject as Figure 1D). Normalized probability distributions are shown, but there were about five times more correct trials than error trials. Arrows indicate median latencies of the distributions (0.743 s for errors, 0.823 s for correct responses). Dashed line is the minimum reaction time this subject showed in any trial or task (0.403 s). (B) Cumulative distributions of reaction time, the integrals of curves shown in panel (A). (C) Median decision time in error trials (x-axis) and in correct trials (y-axis) for each subject (N = 12), for exemplar discriminations in the test phase. The example subject used in panels (A,B) is highlighted (gray). Symbols are above the identity line (diagonal) if correct trials had longer median reaction time.
