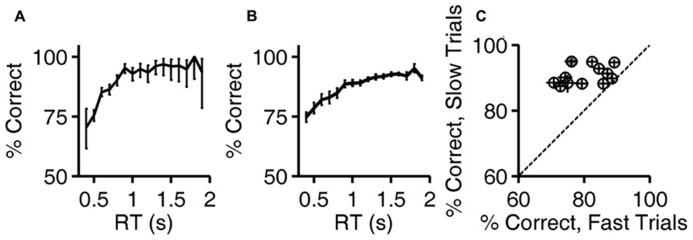
FIGURE 3.

Accuracy improves with reaction time. (A) Accuracy of exemplar discrimination as a function of reaction time for a single subject (same rat as Figures 1D and 2A,B); error bars show the 95% binomial confidence intervals. (B) Accuracy of exemplar discrimination as a function of reaction time averaged over all N = 12 rats; error bars show SEM over the population. (C) Accuracy on exemplar discrimination in fast trials vs. in slow trials in the test phase. Each symbol represents data from a single rat, and error bars show 95% binomial confidence intervals. The example subject used in (A,B) is highlighted (gray). Symbols are above the identity line (diagonal) if slow trials had higher accuracy.
