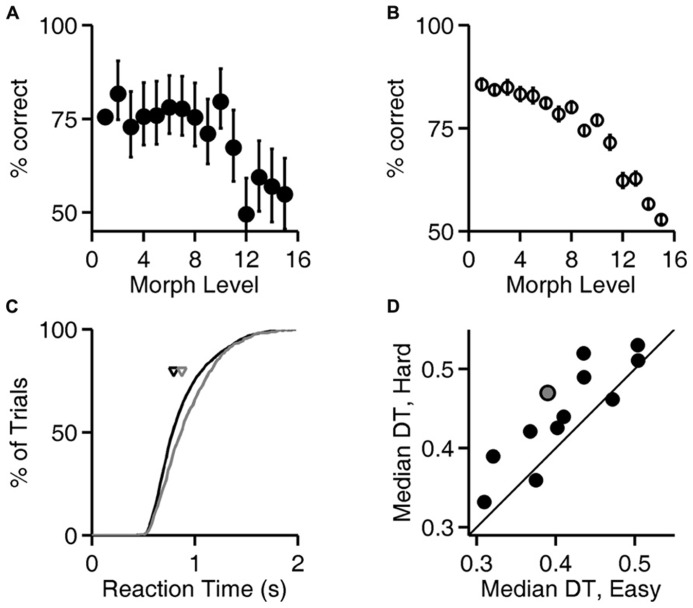
FIGURE 4.
Reaction time increases with trial difficulty. (A) Performance (% correct responses) as a function of stimulus ambiguity (morph level) for one rat (cf. Figures 1D, 2A,B, and 3A). Error bars show 95% binomial confidence intervals. (B) Average performance of all 12 subjects as a function of the similarity of the two images discriminated. Error bars show SEM over the population of N = 12 subjects. (Data re-analyzed from Clark et al., 2011). (C) Cumulative distribution of reaction time for the subject analyzed in panel (A), for the easiest (level 1, black curve) and hardest (levels 12–15, gray curve) trials. Arrows indicate the median latencies of the two distributions (0.793 vs. 0.873 s). This subject’s minimum RT (estimated sensorimotor delay) was 0.403 s. (D) Median decision time (DT; reaction time minus sensorimotor delay) for easiest vs. hardest trial types for all N = 12 rats; data for the subject shown in panels (A,C) is highlighted in gray. Symbols above the diagonal identity line (N = 10/12) indicate a subject that takes more time to respond on harder discriminations.

