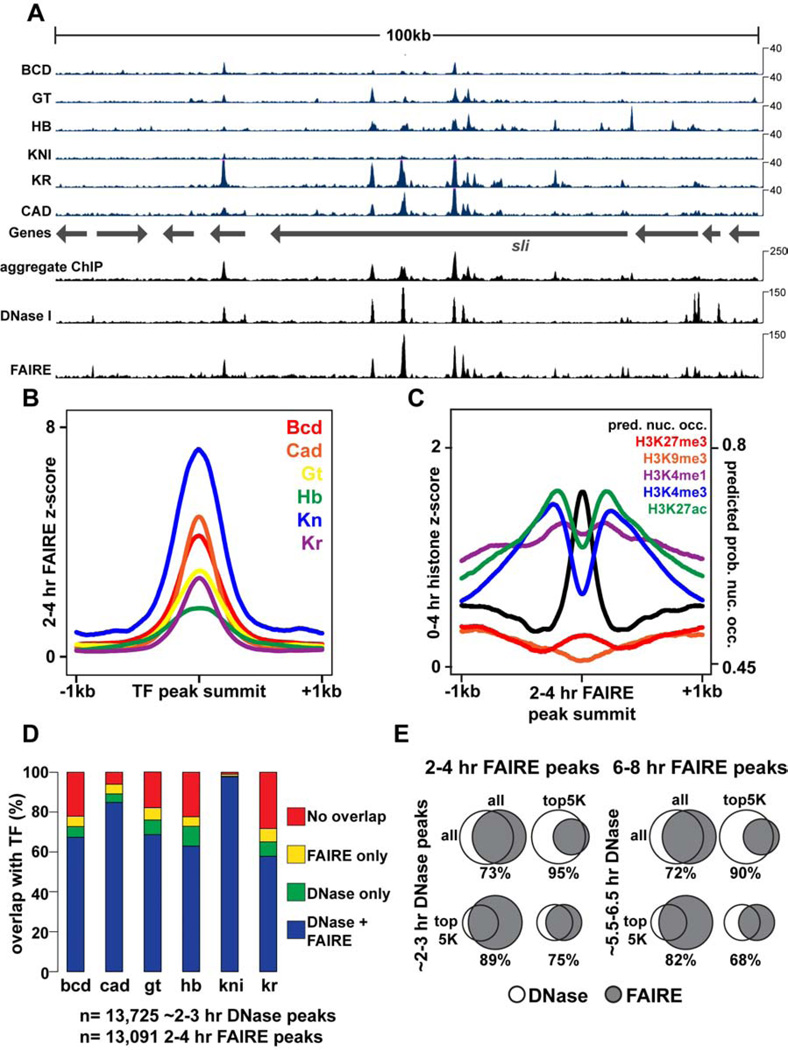
Figure 1. FAIRE identifies open chromatin bound by key developmental regulators.
All times below refer to hours After Egg Laying (AEL), which are estimated for data from other studies. DNase I data are from (Thomas et al., 2011). 2–3 hr ChIP data are from (Bradley et al., 2010). Transcription Factors (TFs): Bcd, Bicoid; Cad, Caudal; Gt, Giant; Hb, Hunchback; Kn, Knirps; Kr, Kruppel. (A) Browser representation of the slit locus. Below the genes track is ChIP signal (blue, Counts Per Million (CPM)) from 2–3 hr embryos, plotted for individual TFs. Above the genes track, from bottom to top, is the aggregate ChIP signal generated by summing the normalized signal from each individual TF, followed by 2–3 hr DNase I signal (CPM), and 2–4 hr FAIRE data (CPM). (B) 2–4 hr FAIRE signal at TF peaks from 2–3 hr embryos. (C) 0–4hr histone modification signals (Negre et al., 2011) and predicted probability of nucleosome occupancy based on DNA sequence (Kaplan et al., 2009) plotted for regions surrounding 2–4 hr AEL FAIRE peaks, centered on the maximum FAIRE signal for each peak. (D) Stacked bar charts showing overlap of ~2–3 hr DNase I and 2–4 hr FAIRE peaks with TF ChIP peaks from 2–3 hr embryos. (E) Venn diagrams depicting peak overlaps between ~2–3 hr DNase I peaks and 2–4 hr FAIRE peaks (left), and ~5.5–6.5 hr DNase I and 6–8 hr FAIRE peaks (right). See also Figure S1.

