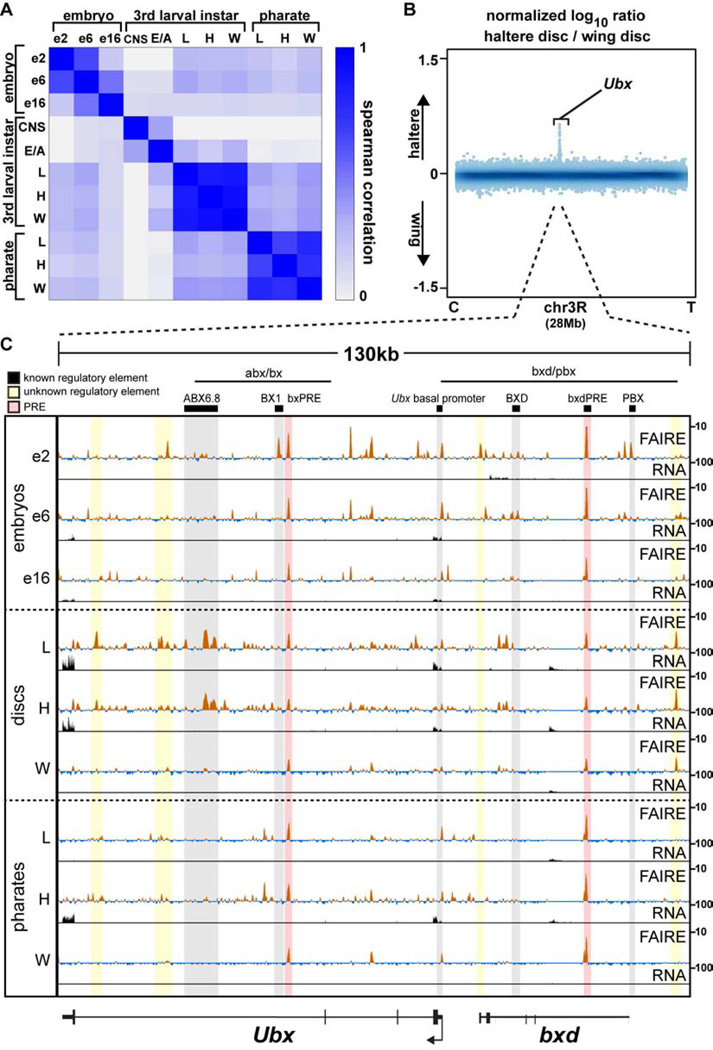
Figure 3. Appendage open chromatin profiles are very similar within a stage, except at master regulator loci.
(A) Spearman correlation coefficients of FAIRE signal in 500-bp windows genome-wide for each pairwise comparison across all samples. (B) Log10 ratio (haltere/wing) of FAIRE signal from chromosome 3R (28Mb). Centromere (C), telomere (T), and the Ultrabithorax (Ubx) locus are indicated. (C) FAIRE (z score: −2 to 10) and RNA (FPKM: 0 to 100) signals at the Ubx and bithoraxoid (bxd) loci in embryos, imaginal discs, and pharate appendages. Horizontal black lines indicate the locations known Ubx regulatory regions (Simon et al., 1990). Black boxes designate the locations of known DNA regulatory elements: (left to right) ABX6.8 enhancer, BX1 enhancer, bxPRE, Ubx basal promoter, BXD enhancer, bxdPRE, PBX enhancer (Chan et al., 1994; Muller and Bienz, 1991; Pirrotta et al., 1995; Qian et al., 1991; Simon et al., 1990; Zhang et al., 1991). Shaded red rectangles indicate the locations of known PREs (Papp and Muller, 2006; Pirrotta et al., 1995). Shaded yellow rectangles indicate the locations of putative regulatory elements identified in this study. See also Figures S2, S3, S4.

