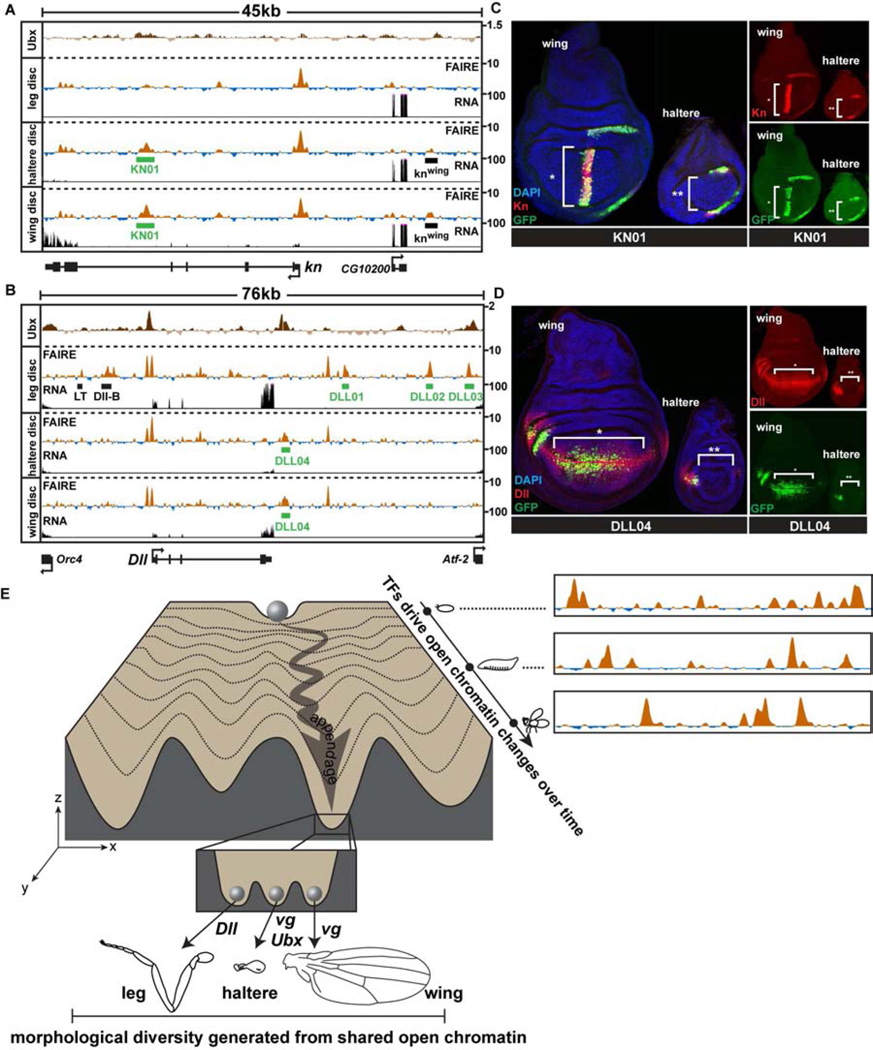
Figure 7. Transcription factors differentially regulate the activity of the same enhancers in different appendages.
(A) FAIRE (z score), RNA (CPM), and Ubx ChIP (log2 ratio) (Choo et al., 2011; Slattery et al., 2011a) signal at the knot (kn) and (B) Distalless (Dll) loci in imaginal discs, with locations of enhancers KN01 and DLL01-04 (green boxes) identified in this study, plotted as in Figure 3C. (C) Confocal images showing reporter activity of KN01 and (D) DLL04 in wing and haltere imaginal discs. Discs were stained for DAPI (blue), and antibodies to GFP (green), and Kn (C) or Dll (D) (red). (E) A conceptual model of the appendage shared open chromatin profiles, depicted within the framework of Waddington’s epigenetic landscape (Waddington, 1957). A range of open chromatin profiles exists within the fly (x-axis) at any single stage of development. These profiles are dynamic over time (y-axis), and differ by varying degrees between tissues (z-axis). Each valley (z-axis) represents the shared open chromatin profile of a developing anatomical structure or tissue (e.g. appendage). The inset depicts the specific group of selector genes expressed in each developing appendage acting upon the same set of open chromatin regions to create morphologically diverse tissues. See also Figure S7.

