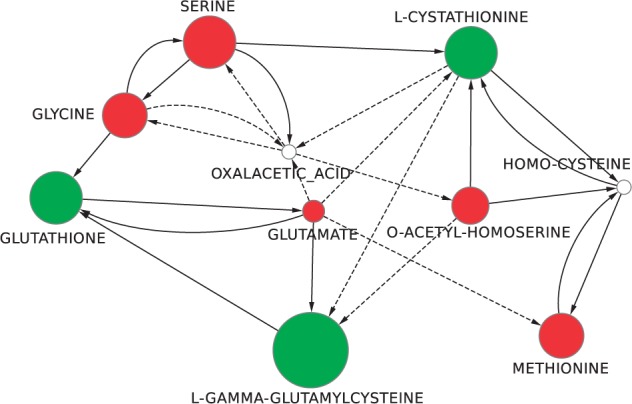
Fig. 2.

The compressed network computed considering as black nodes the eight compounds of the table in Supplementary Material S3 marked as present in the glutathione biosynthetic pathway. Green nodes are the ones whose concentration significantly increased in the presence of cadmium, whereas the red are the ones whose concentration significantly decreased. The diameter of the nodes is proportional to the concentration change. Solid arcs represent single reactions connecting the two compounds, whereas dashed ones correspond to a chain of at least two reactions
