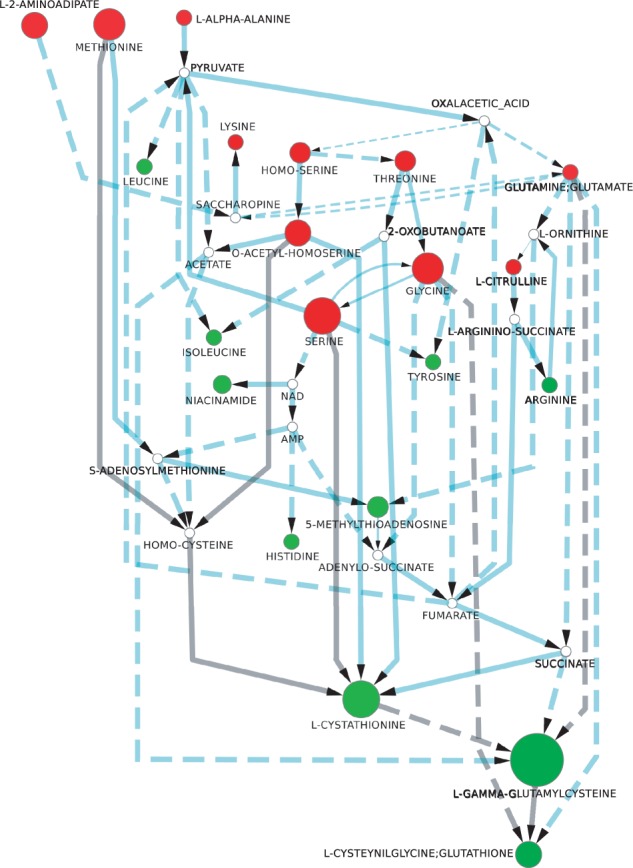
Fig. 6.

Anthology corresponding to the 20 stories with the maximal score computed for the experiment on yeast s288c exposed to cadmium. Red nodes correspond to metabolites whose concentration decreased and green nodes to those whose concentration increased in the metabolomics experiment. White nodes have their concentration unchanged or it could not be measured. The diameter of the nodes is proportional to the concentration change. Solid arcs represent single reactions connecting the two compounds, whereas dashed ones correspond to a chain of at least two reactions. The arc’s thickness represents the frequency of the arc in the stories making up the anthology, whereas gray arcs correspond to reactions known to be part of the response to cadmium
