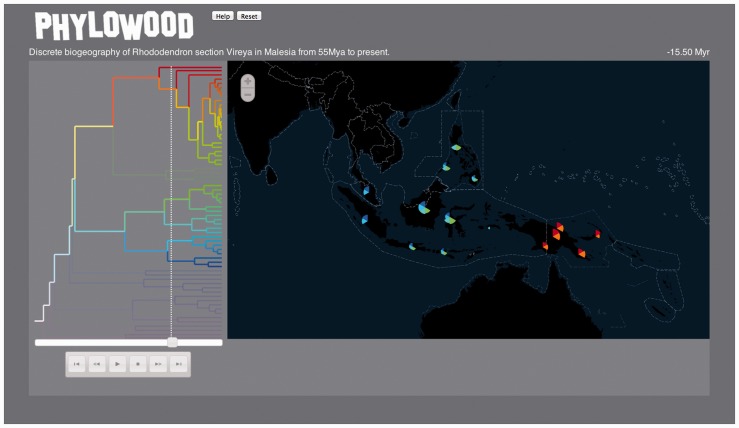
Fig. 1.
Sample still frame from Phylowood. The results shown are from the discrete biogeographic analysis of Rhododendron section Vireya throughout Malesia using BayArea. Much of the phylogenetic tree has been masked using mouse-issued commands, leaving two clades and their shared ancestry unmasked. The media slider indicates the current position of the animation with respect to the time-calibrated phylogeny for which time six unmasked lineages are animated. For the current animation time, each extant lineage is allocated an equal width slice of the pie. For each color, the depth of the slice indicates the approximate marginal posterior probability of the lineage occupying the area at that time. Pie slices are sorted phylogenetically, making the relative position of absent slices informative. Consulting the geography panel, we find the taxa from the top clade appear to be allopatric with respect to taxa from the bottom clade at ∼15.5 Mya. The interactive animation is available at http://mlandis.github.io/phylowood/?url=examples/vireya.nhx

