Figure 1.

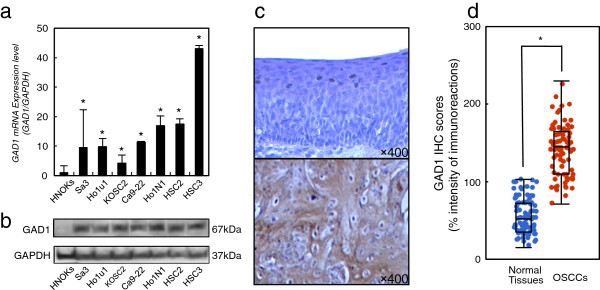
Evaluation of GAD1 expression in OSCC-derived cell lines. a Quantification of GAD1 mRNA levels in OSCC-derived cell lines by qRT-PCR analysis. All OSCC-derived cell lines have significant up-regulation of GAD1 mRNA compared with that in the HNOKs. Data are expressed as the mean ± SEM of values from three assays (*P < 0.05, Mann–Whitney U test). b Immunoblotting analysis of GAD1 protein in the OSCC-derived cell lines and HNOKs. GAD1 protein expressions are up-regulated in all OSCC-derived cell lines examined compared with that in the HNOKs. c Evaluation of GAD1 protein expression in primary OSCCs representative IHC results for GAD1 protein in normal tissue and primary OSCC. Original magnification, ×400. Scale bars, 10 μm. Strong GAD1 immunoreactivity is detected in primary OSCCs. Normal oral tissues show almost weak immunostaining. d The status of GAD1 protein expression in normal oral tissues and primary OSCCs (n = 80). The GAD1 IHC scores for normal oral tissues and OSCCs range from 15 to 103 (median, 52) and 71 to 230 (median, 145), respectively. GAD1 protein expression levels in OSCCs are significantly (*P < 0.001, Mann–Whitney U test) higher than in normal oral tissues.
