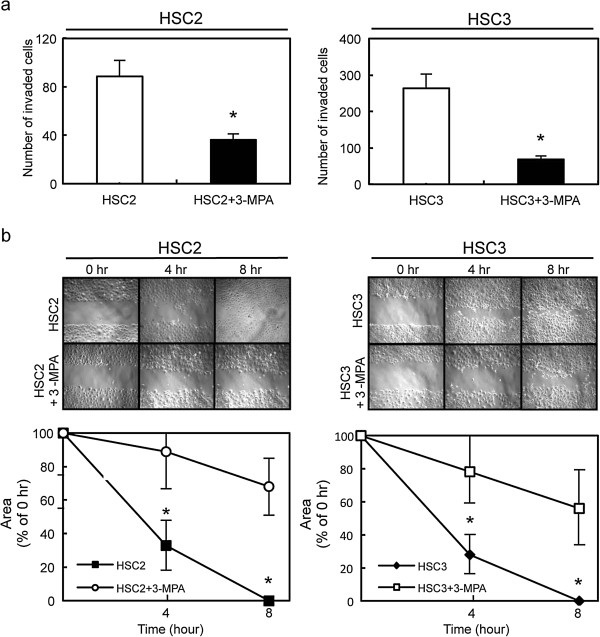
Figure 6.
Functional analysis of the 3-MPA-treated cells. a Invasiveness assay of the 3-MPA-treated cells. After crystal violet staining, the numbers of cells invading the pores are counted (×100 magnification). The numbers penetrating the 3-MPA-treated cells are significantly (*P < 0.05, Mann– Whitney U test) greater compared with control cells. Scale bars, 100 μm. b Migratory assay of 3-MPA-treated cells. The wound area is decreased significantly (*P < 0.05, Mann–Whitney U test) in the culture of control cells after 8 hr, whereas there is still a gap in the 3-MPA-treated cells. Original magnification, ×100. Scale bars, 100 μm.

