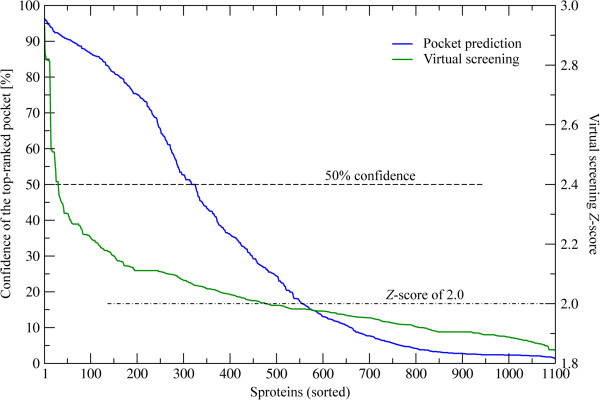
Figure 7.

Confidence of ligand binding prediction for sproteins. Two confidence estimates are plotted: for the location of the top-ranked binding site (blue, left y-axis) and for the reliability of ligand virtual screening (green, right y-axis). The horizontal dashed and dot-dash lines show 50% confidence and 2.0 Z-score thresholds, respectively.
