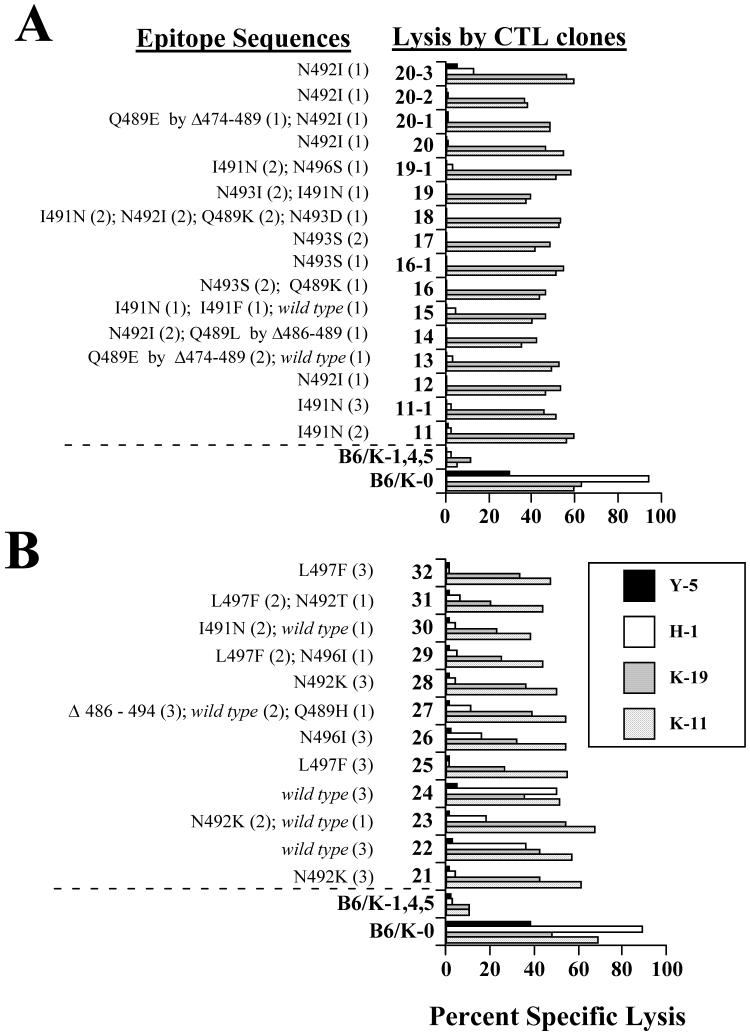
Fig. 5.
Epitope sequences and lysis of H-1- and Y-5-selected populations. A. Analyses for H-1-selected populations. B. Analyses for Y-5 -selected populations. Epitope sequences identified by sequencing recombinant clones representing each CTL-selected population are shown. The numbers in the parentheses indicate the number of each sequence type that was obtained for that population. Each of the CTL-selected populations or control cell lines (B6/K-0 or B6/K-1,4,5) were combined with the indicated CTL clones (K-11, K-19, H-1 or Y-5) in standard four hour cytotoxicity assays. Legend for A is as shown for B.

