FIGURE 4.
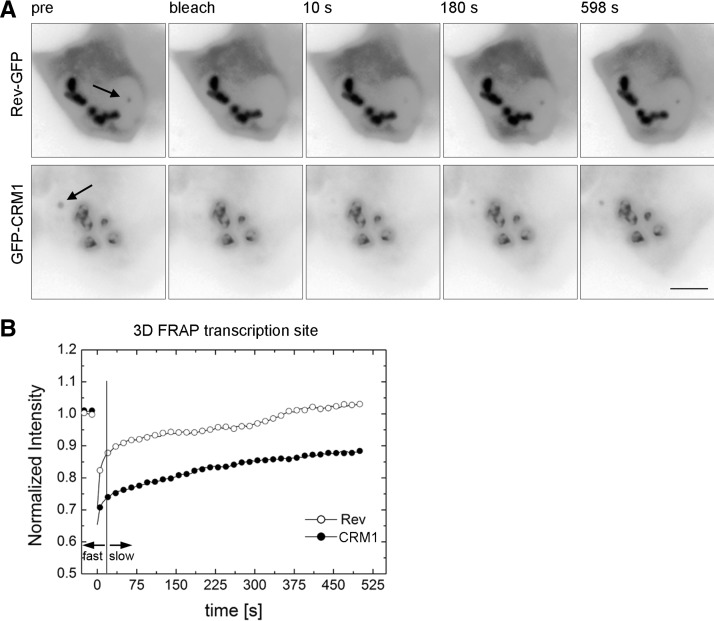
3D FRAP of Rev-GFP and GFP-CRM1 at the transcription site. (A) Exo1 cells were transfected with either Tat and Rev-GFP (upper), or with Tat, GFP-CRM1, and Rev-Flag (lower). FRAP was performed with the 3D FRAP method. Micrographs show selected time points: prebleach and 10 sec, 180 sec, and 598 sec post-bleach. Arrows indicate the position of the transcription sites. (B) Plot of the recovery curves of Rev-GFP and GFP-CRM1 at the transcription site using the 3D FRAP method. The vertical line indicates the transition point between the fast and slow fractions. (Open circles) Rev-GFP; (closed circles) GFP-CRM1; (scale bar) 5 µm.

