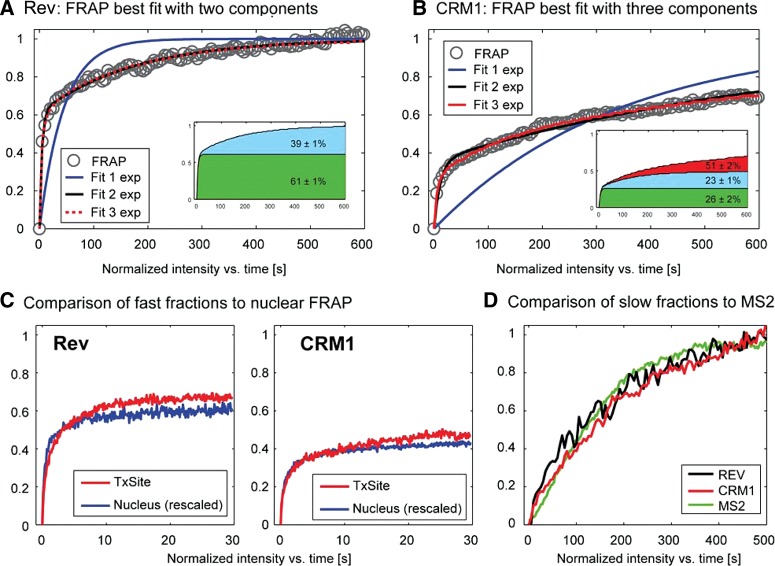
FIGURE 5.
Analysis of Rev-GFP and GFP-CRM1 3D FRAPs at the transcription site. (A,B) The FRAP data of Rev-GFP and GFP-CRM1 were fitted with a monoexponential, a double, or a three exponential function. Insets show the sizes of the slow, medium, and fast fraction. (C) Comparison of the nucleoplasmic FRAP of Rev and CRM1 with the fast component of Rev-GFP and GFP-CRM1 recoveries at the transcription site. The FRAP data were rescaled for better comparison. (D) Plot of the recoveries of the slow component of Rev-GFP (black), CRM1-GFP (red), and MS2-GFP (green) at the HIV-1 transcription sites. The curves were rescaled from 0 to 1 for better comparison.

