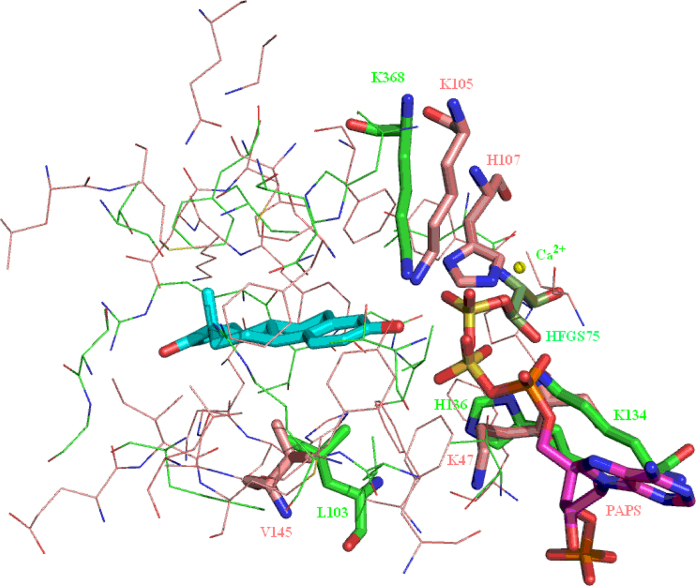
Fig. 31.
Overlay of the sulfotransferase and sulfatase oestrogen binding sites. Comparison of sulfotransferase (protein: pink carbons, PAPS: purple carbons) and sulfatase (protein: light green carbons, HFGS75: dark green carbons). Estrone is shown with cyan carbons. (For interpretation of the references to colour in this figure legend, the reader is referred to the web version of this article.)

