
Figure 1.
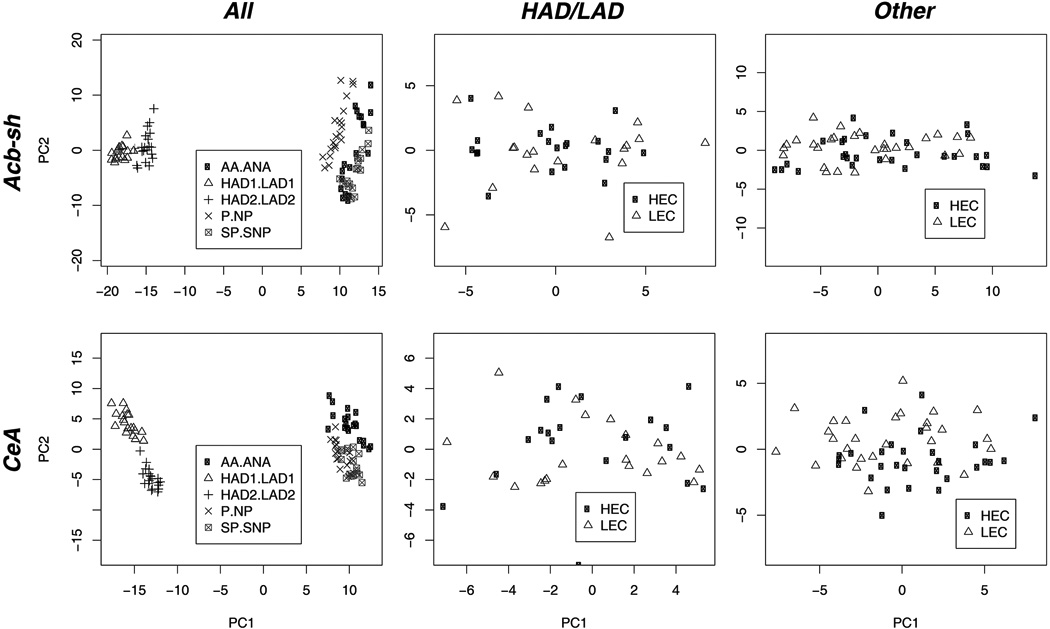
Principal components analyses (PCA) for genes found significant in the ANOVA of the 5 line-pairs for the AcbSh (upper 3 panels) and CeA (lower 3 panels). Plots on far left are of processed expression data with animals labeled by line-pair for all 5 line-pairs. The middle and far right plots are derived from the residuals after linear modeling taking into account line-pair only, which allows for a view of the data with only ethanol consumption as a factor. Data for the replicate HAD-LAD lines are plotted in the middle panels; data for other 3 line-pairs are plotted in the far right panels.