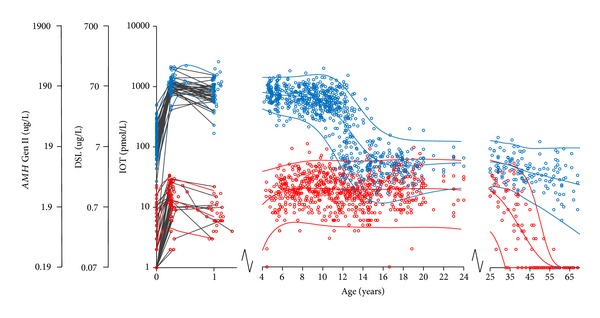
Figure 2.

Serum AMH in 1953 healthy subjects (926 females and 1027 males) according to age. Females: red circles, males: blue circles. Longitudinal values during infancy are connected with grey lines. The red and blue curves represent the female and male reference ranges, respectively (median, ±2SD). The figure was redrawn from our previously published data using Immunotech Coulter enzyme immunometric assay in all subjects [11–13]. Please note the logarithmic y-axis. The y-axes for the DSL and Gen II assays were created using the following formulas: AMH (IOT) pmol/L = 2.0 × AMH (DSL) ug/L × 7.14 pmol/ug and AMH (IOT) pmol/L = 0.74 × AMH (Gen II) ug/L × 7.14 pmol/ug.
