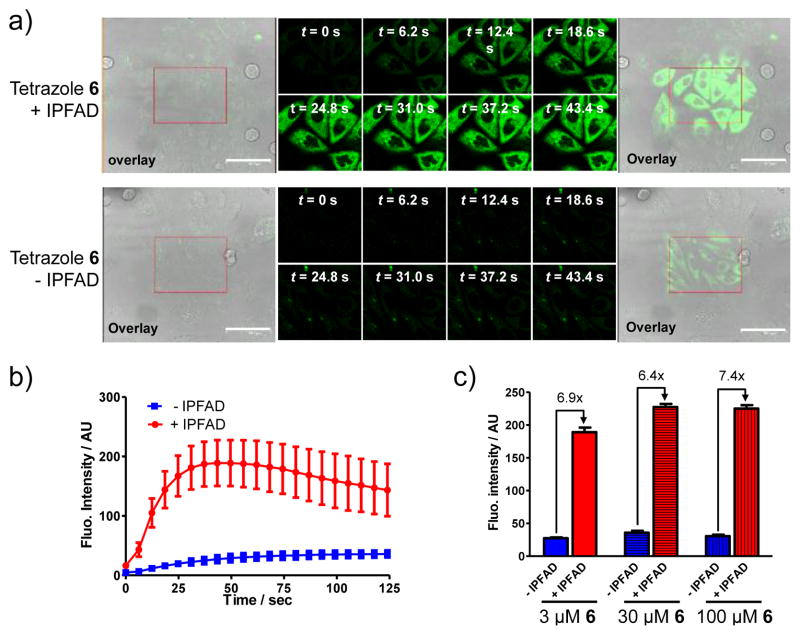
Figure 4.
Fluorescence microscopy of the fluorogenic, two-photon triggered photoclick chemistry in CHO cells. (a) Fluorescence/DIC overlap image before photoirradiation (panel 1), time-lapsed fluorescence images (panels 2–9) and fluorescence/DIC overlap image after photoirradiation (panel 10). CHO cells were treated with 3 μM tetrazole 6 in the presence (top row) or absence (bottom row) of 40 μM IPFAD followed by photoillumination of the red rectangle area with a 700 nm femtosecond pulsed laser. Scale bar = 61.3 μm. (b) Time courses of fluorescence development in ten cytosolic regions in selected CHO cells; red curve denotes the regions in the IPFAD-treated cells while blue curves denote the regions in the untreated cells. The concentrations of tetrazole 6 and IPFAD were 3 μM and 40 μM, respectively. (c) Effect of tetrazole 6 concentration on fluorescence intensity monitored by confocal microscopy. See Figure S21 for details.

