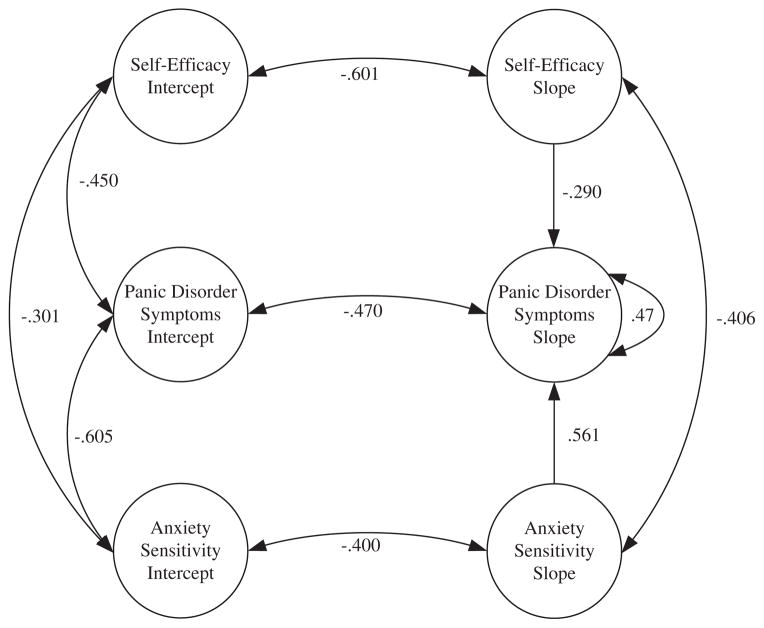
Fig. 1.
Completely standardized results of parallel process latent growth curve model of self-efficacy, anxiety sensitivity, and panic symptoms in which panic symptoms slope is regressed on self-efficacy and anxiety sensitivity slopes. Note: covariances between intercepts and slopes across constructs (e.g., anxiety sensitivity intercept slope with self-efficacy slope) were estimated but are not presented in order to simply the presentation of the results. Model fit: χ2 (501) = 1657.20, p < .001; RMSEA = .08, 90% CI: .076, .084, CFI = .92, NNFI = .92, SRMR = .07.

