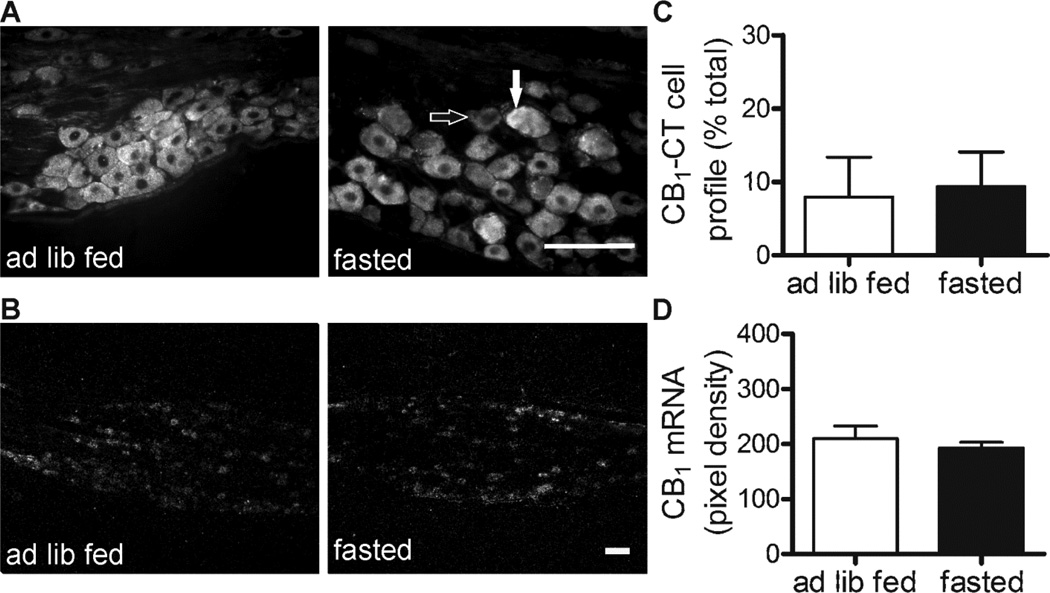
Figure 2.
CB1-CT immunoreactivity (A) and CB1 mRNA expression (B) in nodose ganglia from chow fed rats ad libitum fed (ad lib fed) or fasted for 24 h (fasted). Scale bars: 100 µm. An example of an immunopositive cell (closed arrow) and an immunonegative cell (open arrow) is indicated. Quantification of CB1-CT immunoreactivity (C) and CB1 mRNA levels (D). Bars represent the mean ± s.e.mean, n = 3 per group.

