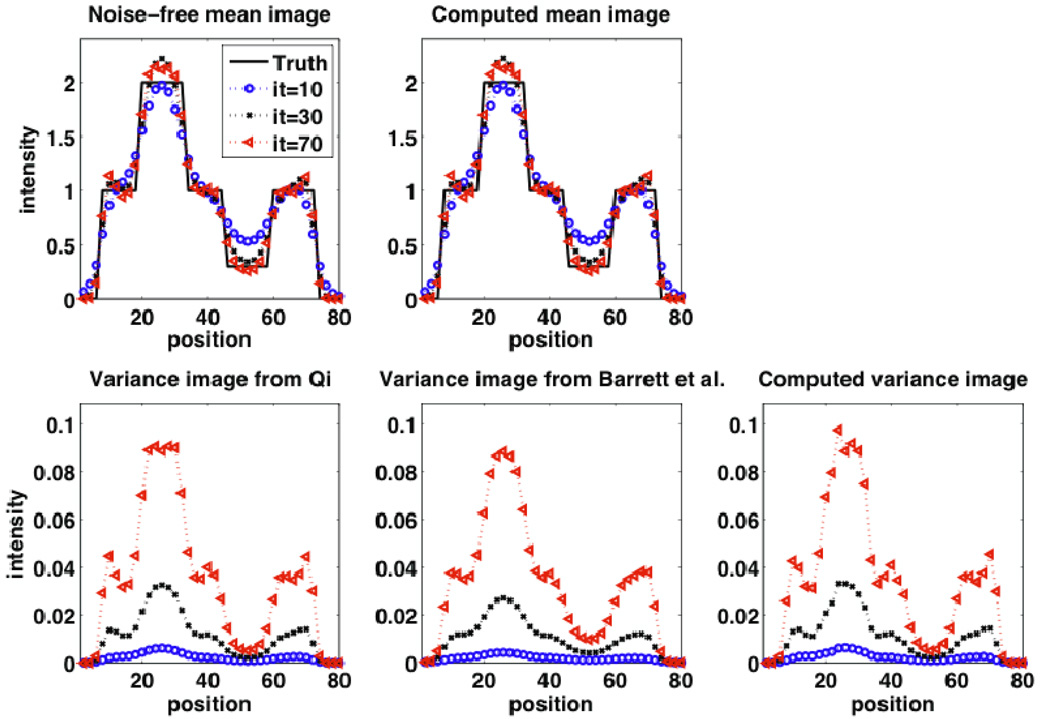
Figure 4.
(row 1): (left) Noise-free reconstructions, and (right) mean images computed from noise realizations; (row 2): Analytic variance image based on the method of (left) Qi and (center) Barrett et al., as well as (right) the variance image computed from noise realizations (to obtain these plots with very good quality, 1000 noise realizations were generated). Results are shown for iterations 10, 30 and 70. All reconstructed images shown are for the case of RM. The observed edge artifacts were not seen in the case without RM (not shown).

