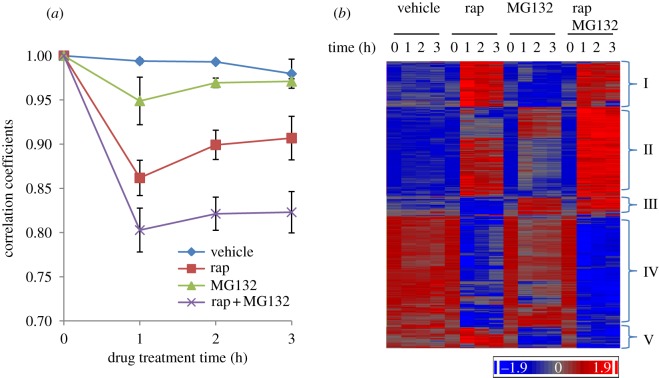
Figure 1.
(a) Change of correlation coefficients of the transcriptome during drug treatment. These coefficients were calculated between the initial sample and those 1, 2 and 3 h after introduction of the drug. The mean and s.d. were calculated from biological triplicates. (b) Hierarchical clustering of genes whose mean transcript levels were changed more than 1.5-fold by drug treatment.

