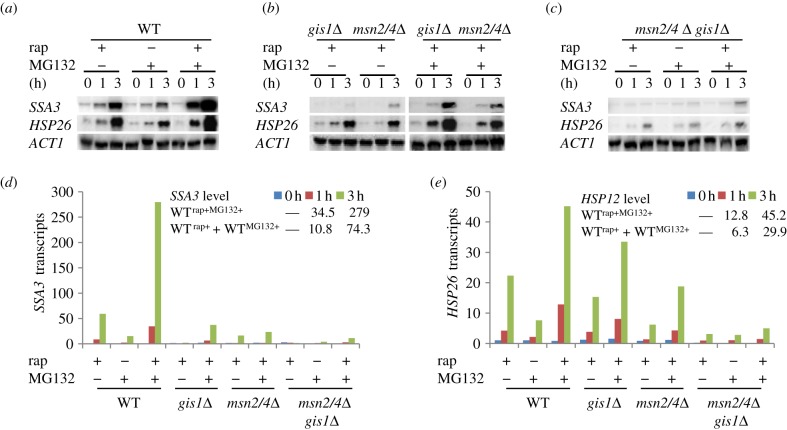
Figure 5.
(a–c) SSA3 and HSP26 transcripts detected in WT (a), gis1Δ and msn2/4Δ (b), and gis1Δmsn2/4Δ (c) cells treated with MG132 and/or rapamycin. (d,e) Normalized transcript levels of SSA3 (d) and HSP26 (e) to that of ACT1 in WT and mutant cells. The value at time 0 of treatment with rapamycin in WT cells was set to an arbitrary unit of 1.

