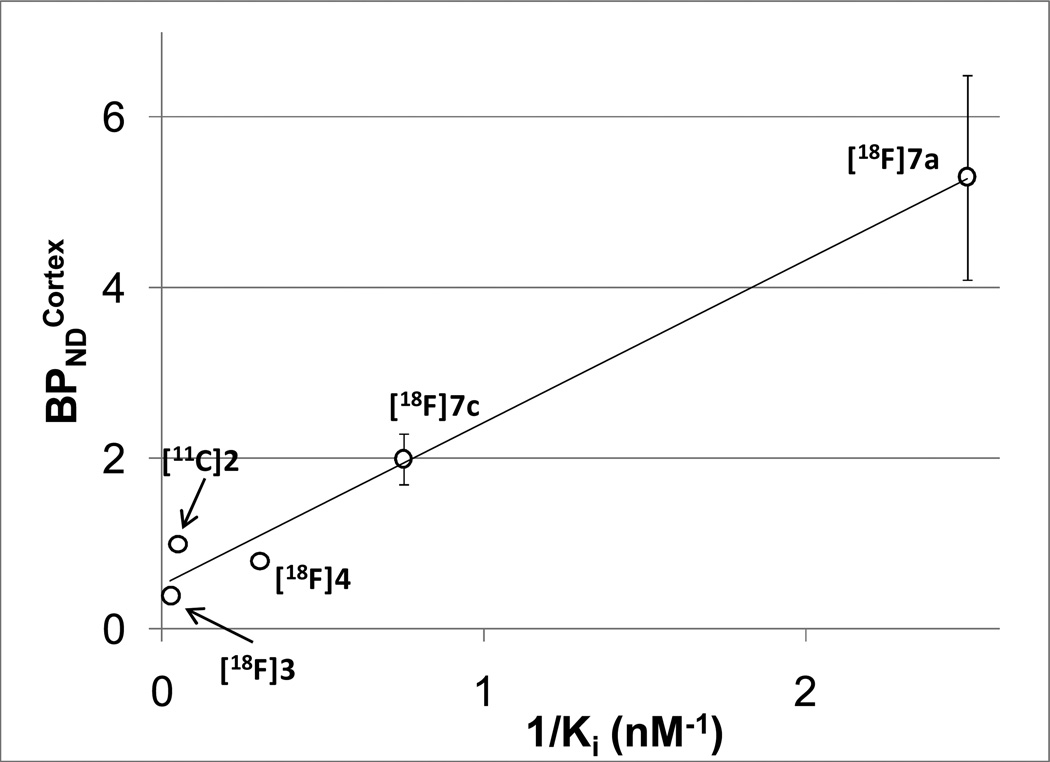
Figure 9.
Correlation of the BPNDcortex (unitless) vs. 1/Ki (nM−1) of α7-nAChR PET radioligands [11C]2, [18F]3, [18F]4, [18F]7a and [18F]7c (y = 1.91x + 0.52, R2 = 0.98). The BPND values are shown in the Tables 1 and 3; the SD values are available for [18F]7a and [18F]7c only. All Ki values were obtained in this study under the same binding assay conditions (Tables 2 and 3).

