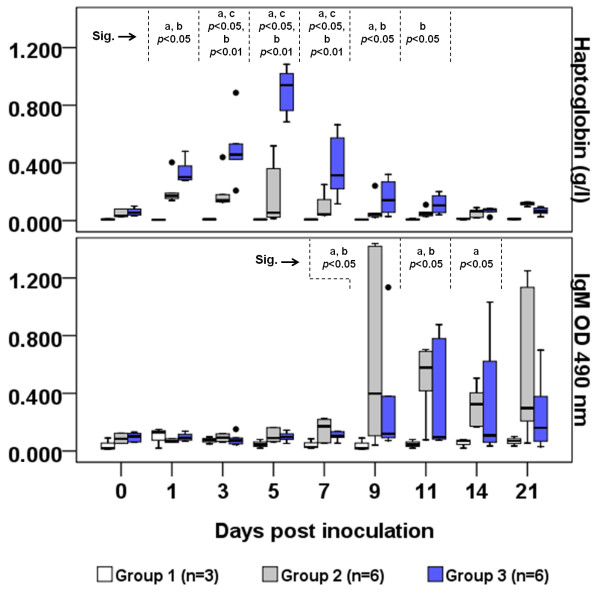
Figure 1.
Distribution of haptoglobin and IgM values in sheep during CLA’s acute phase period. Values are expressed as boxplot graphics, in which boxes represent the median value (line within box) and 25th and 75th percentiles (bottom and top of box); whiskers represent the 2.5th and 97.5th percentiles; and dots represent outliers. Group 1, control group: animals inoculated with 0.09% saline solution; Group 2: inoculation with 2 × 10⁵ CFU of Corynebacterium pseudotuberculosis (Cp) VD57 wild strain; Group 3: immunization with 250 μg of CDM-secreted antigen plus 1.5 mg saponin. Significant differences (Sig.) between groups in Mann–Whitney test are presented at the top of each graphic with superscript letters: a = Groups 1 and 2, b = Groups 1 and 3, c = Groups 2 and 3.

