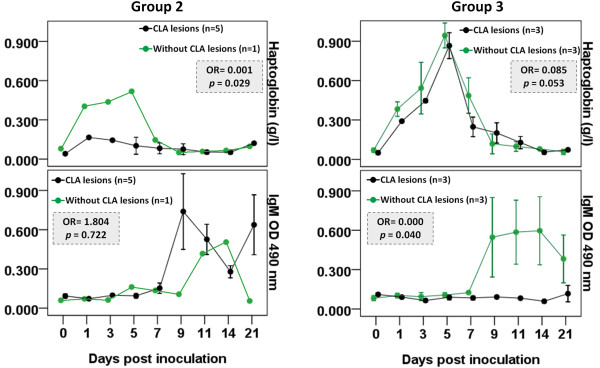
Figure 2.

Haptoglobin and IgM values in Groups 2 and 3 according to CLA status. Values are expressed as mean ± standard error. Sheep were clustered by the absence (green) and presence (black) of CLA lesions. Group 2: inoculation with 2 × 10⁵ CFU of Cp VD57 wild strain; Group 3: immunization with 250 μg of CDM-secreted antigen plus 1.5 mg saponin. The association between variables and the clinical progression (presence or absence of CLA lesions) was examined through binary logistic regression, and odds ratios (OR) are presented in grey boxes. Association was considered significant if the P value was less than 0.05. The Hosmer and Lemeshow test P values were 0.221 (Group 2) and 0.803 (Group 3).
