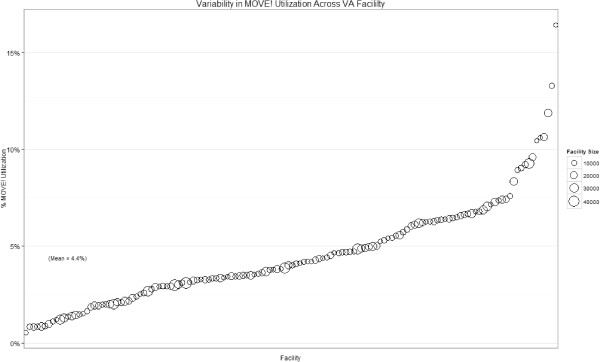
Figure 2.
Variability in MOVE! utilization across VA facility. Legend: Displayed is the variability in facility level percentage of patients utilizing MOVE services. The 140 VA facilities are ordered from smallest to largest percentage and the size of each point represents the number of patients within each respective facility.

