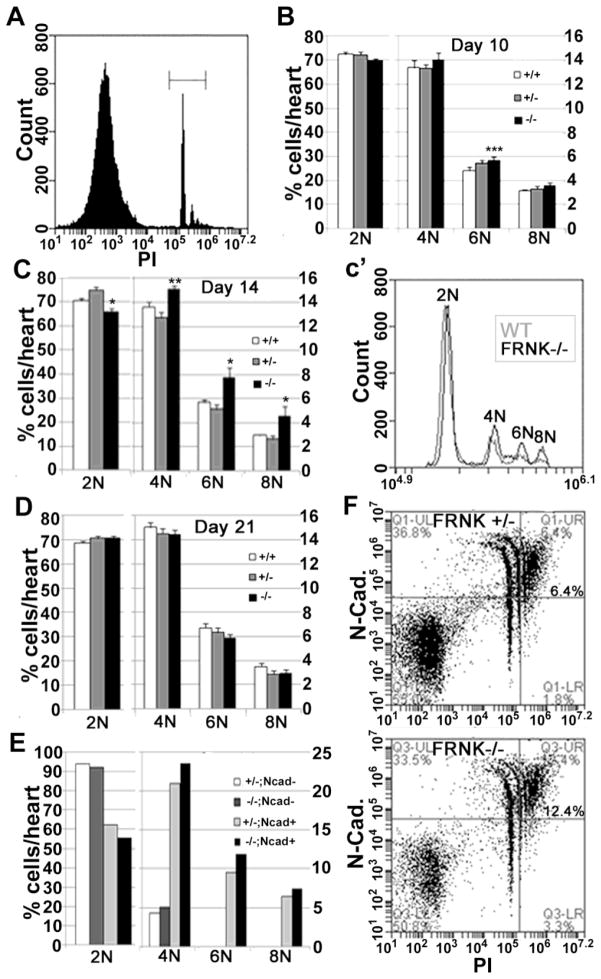
Figure 3. FRNK depletion leads to a transient elevation in cardiomyocyte multi-nucleation.
A. Representative propidium iodide (PI) staining of cardiac cells showing gating on PI positive cells (denoted by bracket). B–D. Quantification of relative numbers of 2N, 4N, 6N and 8N positive cells from wild type (+/+), FRNK +/− (+/−), and FRNK−/− (−/−) hearts at postnatal day 10, 14 and 21. c′ shows a representative histogram showing relative DNA content in cells from FRNK−/− (black) and WT (grey) P14 hearts. (Flow experiments represent at least 2 experiments per data point, n= P10- 6,9,8; P14- 5,9,4; P21- 6,9,8 for wt, FRNK+/−, and FRNK−/− respectively. *-- p≤0.05 for FRNK−/− vs. both FRNK +/− and WT, **- p≤0.05 only vs. FRNK +/−, ***- p≤0.05 only vs. WT. E–F. DNA content of N-cadherin positive (Ncad+) and negative (Ncad−) cells with a scatter plot (F) showing increased DNA content in Ncad+ cells from FRNK−/− hearts in upper right quadrant. Values represent pooled samples from 6–7 hearts.

