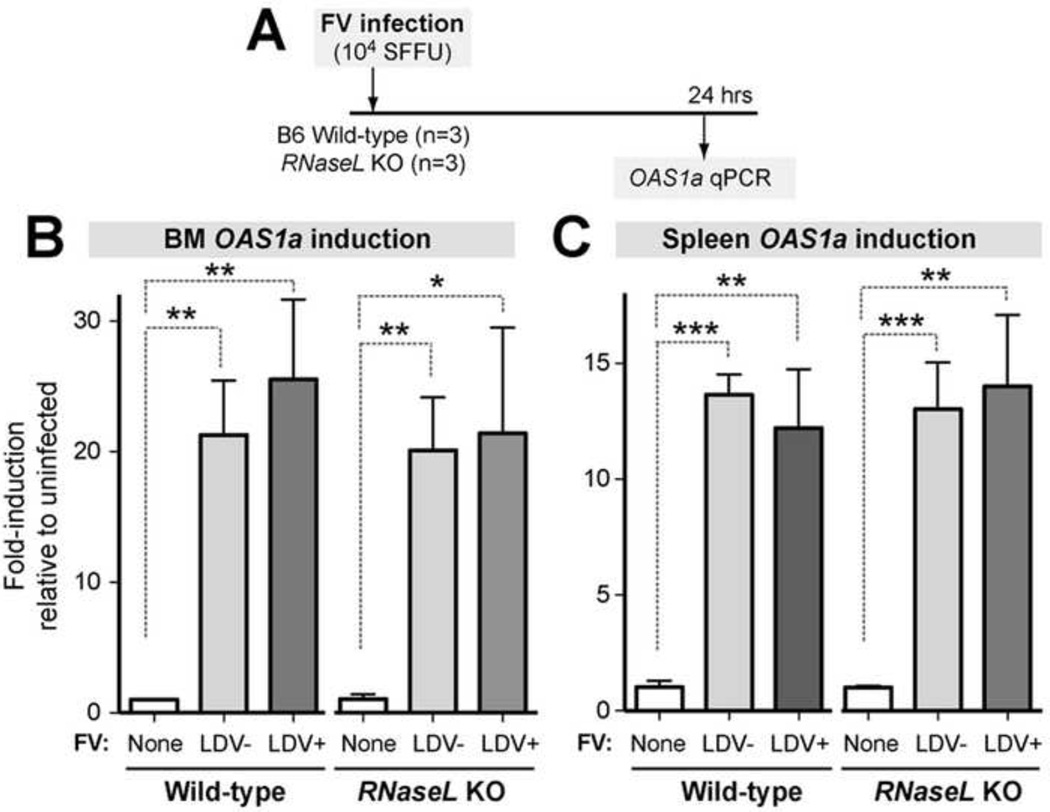
Fig. 4. Transcriptional induction of OAS1a following FV infection in WT and RNaseL-deficient mice.
(A) Timeline. Relative OAS1a transcript levels were measured by qPCR, normalizing for actin levels. Fold-induction levels were normalized against the mean OAS1a expression levels in uninfected mice. (B) BM OAS1a mRNA levels. (C) Spleen OAS1a mRNA levels. Statistical tests were performed using a 2-tailed Student’s t test, with *, p<0.05, **, p<0.01, and ***, p<0.001. Bars correspond to standard deviations from mean OAS1a levels from 3 mice each. For each mouse, mean OAS1a levels were obtained from 3 technical replicates.

