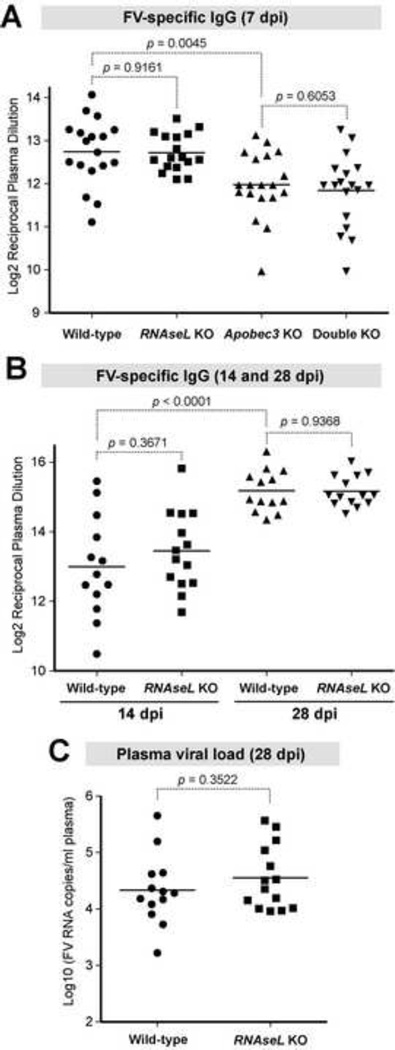
Fig. 5. RNaseL did not significantly influence the FV-specific IgG response or recovery from FV viremia.
Mice were infected with 104 SFFU of FV and plasma FV-specific IgG titers at indicated timepoints were analyzed by endpoint ELISA against native FV virions. (A) 7 dpi IgG titers from groups of mice described in Figures 3–4. (B) Endpoint IgG titers at 14 dpi and 28 dpi. The data pooled from two independent experiments. (C) Plasma viral RNA load at 28 dpi from the same mice in (B) were analyzed by qPCR. For all panels, each dot corresponds to an infected mouse, and bars correspond to mean values. Differences between pairs of experimental groups were evaluated using 2-tailed Student’s t test, with p<0.05 considered statistically significant.

