Chemotaxis is the ability of living systems to sense chemical gradients in their surroundings and react accordingly. Most prominent chemotactic behavior is exhibited by simple microorganisms that are able to migrate towards gradients of concentrations of the chemo-attractant, by activation of complex intracellular sensing cascades making use of specific chemoreceptors.[1] Classical demonstrations of this phenomenon were described by Engelmann, who observed the accumulation of Bacterium termo, a rod-shaped bacterium, in oxygen-rich surroundings of cells undergoing photosynthesis.[2] Yet, other bacteria can show completely different behavior, such as Spirillum tenue, which is repelled by high oxygen pressure, presenting an anti-chemotactic behavior.[3]
Increasing research in the field of artificial micro- and nanomotors has revealed enormous advances and several similarities not only to biological motors, but also to bacteria.[4] Recently, several sources including magnetic field,[5] light,[6] temperature,[7] electrical stimuli,[8] or ultrasound waves[9] have been employed for external control over the motion of microscopic motors. Enzymes and DNA used as motors showed attraction to chemical gradients, that is, chemotaxis.[10] Sen et al. reported the chemotactic behavior of Janus motors powered by polymerization reactions.[11] The same group studied the chemotaxis of bimetallic rods in a gradient of hydrogen peroxide solution when a H2O2-soaked agarose gel was placed on a cover slip containing the nanomotors suspension.[12] The study was also performed using capillaries containing different concentrations of H2O2 as chemo-attractant, similar to the classical experiments on bacterial chemotaxis.[13] The authors described that the motion of the self-propelled rods presented a slight bias directed towards the capillaries with higher H2O2 concentration. Recently, Solovev et al. reported that catalytic tubular microjets can be attracted to specific targets by using capillary forces.[14] This effect takes place at the air–liquid interface and resembles the motion of water striders, induced by the meniscus climbing effect. There is thus the possibility that the capillaries used for the chemotaxis of nanorods may also have contributed to a physical attraction force (capillary force) in addition to the chemical attractive force provided by the H2O2. To date, there is a lack of chemotactic studies in which the attraction of artificial motors within the bulk liquid only originates from the chemical source, thereby ruling out any other external factor, such as capillary forces. Moreover, the movement of living organisms and the chemotactic motion of bacteria varies depending on their size and shape.[15] Thus, a comparative study between artificial chemotaxis of two types of motors, with different shapes and size within the same system, is of great interest.
Herein, we present the chemotactic attraction of two types of catalytic motors (tubular microjets[16] and Janus particles[5h]) towards high concentrations of hydrogen peroxide, which is used both as a fuel and as chemical attractant, in a microfluidic device where the capillary forces that act at the air–liquid interface can be neglected. We quantified the deviation angle (opening angle β) the motors experience once the intersection of the channels is reached for different concentrations of the chemicals. Remarkably, although driven by different propulsion mechanisms, both types of catalytic motors, tubular microjets and spherical Janus beads, orient and deviate towards higher hydrogen peroxide concentrations. We observed that spherical motors are more sensitive to the gradient of the fuel imposed in the system, which is probably governed by the processes of translational and rotational diffusion of the catalytically active motors. Their “turn” is different in magnitude, making the shape of the artificial motors an important parameter in the movement through chemotaxis.
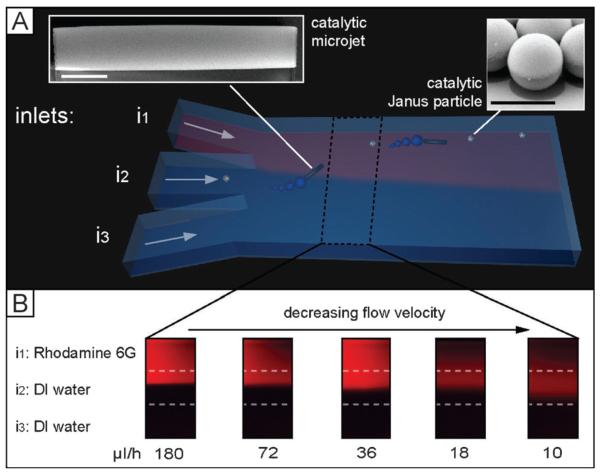
We designed a three-inlet parallel flow device in a Ψ-channel geometry[17] (Figure 1A and Experimental Section) where colloidal micromotors flow through the central channel, whereas the aqueous solutions (with or without H2O2) flow in the other two side-channels.
Figure 1.
Chemotactic attraction of catalytic micromotors in a microfluidic device. A) Three-dimensional scheme of a microfluidic flow cell with three merging inlets in Ψ-shape (i1, i2, and i3) on the left and one larger outlet on the right. Inlet i1 contains the fuel for catalytic motors, which are introduced through inlet i2 and depicted in the insets on the top left (microtubes) and top right (Janus particles). i3 contains water. Scale bar: 5 μm. B) Flow test using fluorescent Rhodamine as model introduced in i1 to visualize flow-speed-dependent diffusion of the dye molecules across the channel.
Microfluidics offers a high degree of control over the chemical environment where analytes, microorganisms, or particles are spatially localized. In addition, it enables the impact of various undesirable factors, such as capillary forces that may interfere with the results of the analysis, to be decreased. Since the fluid flows and channel geometries can be precisely controlled, microfluidics seems an excellent tool for systematic quantitative analysis where gradients at the microscale are involved, for example, chemotaxis.[18]
We performed control experiments to evaluate and optimize the flow profiles formed by the merging of three channels inside of the microfluidic chip. These experiments were realized by labeling hydrogen peroxide solution flowing in the upper inlet i1 (Figure 1B) with the fluorescent dye (Rhodamine 6G) and at same time pumping unlabeled water into two other inlets (i2 and i3). The profiles of Rhodamine 6G as model molecule were examined by fluorescent microscopy which allows 1) visualization of the interface between the fluorescent solution containing hydrogen peroxide and pure water and 2) determination of the evolution of the chemo-attractant profile across the channel upon changing the injection rates. Note that, however, the flow profiles of hydrogen peroxide at various flow speeds would be slightly different from that of Rhodamine 6G. We investigated the evolution of the hydrogen peroxide gradient across the channel with respect to the changes of the total injection rate Qtotal (range of 10–180 μLh−1), which is representing a sum of the flow rates Q1, Q2, and Q3 of the liquids, injected through inlets i1, i2 and i3, respectively. As expected, a decrease of the flow speed allows for stronger interdiffusion and leads to spreading of the hydrogen peroxide into channel i2. To maintain a controlled profile of the flows, we kept the total three inlet flows Qtotal constant at 140 μLh−1.
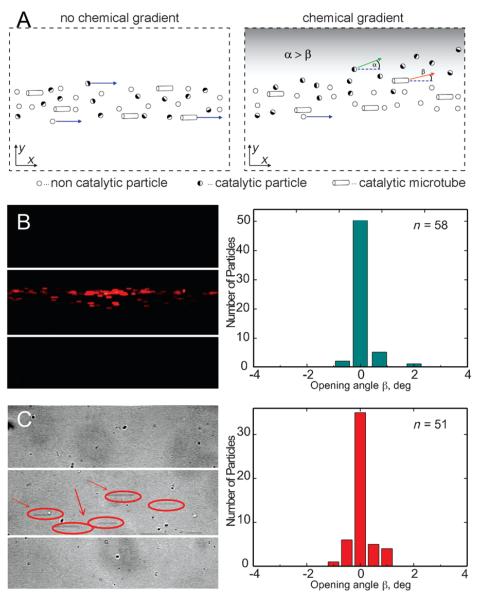
Catalytic motors, dispersed in the aqueous solution are injected through the central channel i2 into the microfluidic device. Various concentrations of hydrogen peroxide 0, 5, 10, and 15% wt/wt and pure water were pumped through the inlets i1 and i3 at the equal injection rates Q1 and Q3, respectively. To prevent the aggregation of the motors (microjets, Janus particles) and their adhesion to the microchannel walls, 1 wt% of sodium dodecyl sulfate (SDS) was added into all the solutions. Once the catalytic motors reach the intersection area and “feel” the gradient of the fuel molecules they experience chemotactic attraction towards higher concentrations of hydrogen peroxide. This results in the deviation of the direction of the particles motion from the central part (parallel to the channel axis, i2) to the upper part of the channel (towards i1), containing more peroxide molecules. This deviation is quantified by tracking of the trajectories of the catalytic motors and estimating the opening angle β, determined as an angle between the vectors, tangential to the trajectories of the particle and parallel to the center line of the channel (see Figure 2A). To investigate and rule out the effect of lateral flows caused by the inflow channels, we pumped non-catalytic reference particles (polystyrene, 3 μm) through the middle channel (i2), 10% H2O2 through i1, and water through i3. In this negative control experiment, we neither observed a change in their motion along the channel nor deviation towards the chemo-attractant (Figure 2B). In addition, to further exclude the possible variation on the channel flows influencing the deviation of the motors, we injected catalytic motors through the central channel i2 and water through i1 and i3, all of them at the same initial flow rates. Results showed that catalytic motors maintain straight motion and only few of them present a small deviation (opening angles β less than 1 degree) of their motion (Figure 2C), which could be attributed to the local inhomogeneities of the flow profile in the channel or small asymmetry of the tubular microjets.
Figure 2.
Principle of quantitative chemotactic analysis. A) Chemotactic behavior of the catalytic motors is quantified determining the opening angle β. Negative control experiments: B) non-catalytic fluorescent polystyrene particles in the gradient of hydrogen peroxide (10% H2O2 wt/wt in i1, 0% H2O2 in i3) do not experience chemotactic deviation of the motion towards fuel-rich area; Plot represents histogram from the opening-angle analysis for the non-catalytic particles, which shows zero opening angle. C) Catalytic tubular microjets, injected through the central inlet do not deviate (0% H2O2 in i1, 0% H2O2 in i3) if there is no fuel added to the solution. Histogram shows that majority of the motors do not experience any deviation. Injection flow rates are fixed to 140 μLh−1.
These control experiments indicate that the flowing conditions do not influence the chemotactic motion of catalytic motors and that the chemical composition (H2O2 aqueous solution versus deionized (DI) water solution) does not influence the migration of the particles towards one channel or another. We also inverted the channel configuration flowing H2O2 through i3 and water through i1 with the same results, that is, micromotors deviating towards the gradient of H2O2 (data not shown).
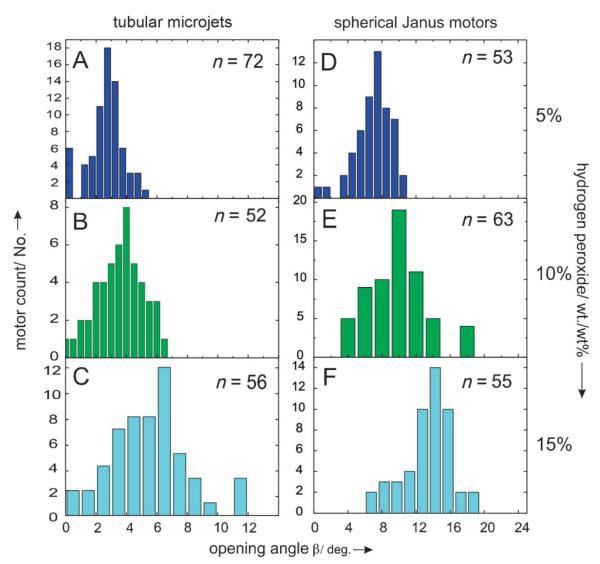
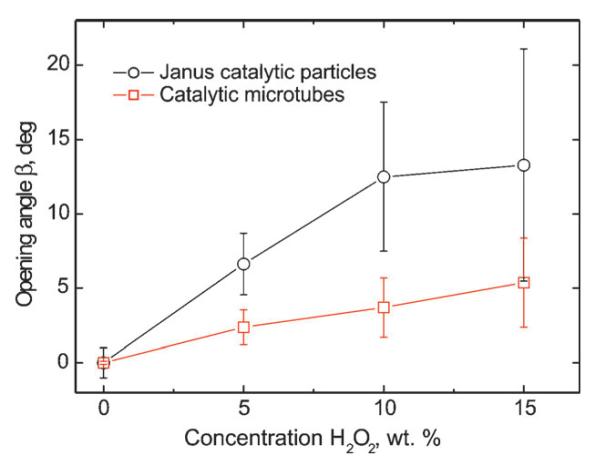
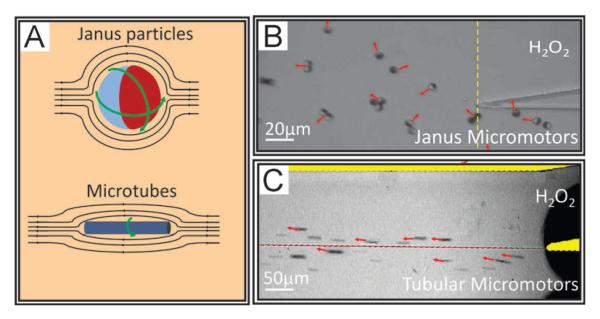
We injected different concentrations of hydrogen peroxide acting as chemo-attractant through the inlet i1 to investigate the effect of the fuel gradient profile on the chemotactic behavior of the catalytic objects. While both catalytic objects feel attracted towards the fuel, spherical particles reveal larger opening angles β than tubular microjets. A systematic study on different concentrations of attractant from 5% to 15% wt/wt shows that tubular microjets only slightly increased the mean opening angle from 3°, 4° to 5° (Figure 3A–C) whereas spherical Janus motors deviate with average angles of 8°, 10°, and 14° respectively (Figure 3D–F). All the plots were derived from a set of at least 50 motors (n > 50). As shown in Figure 3, spherical motors experience broader dispersion on the opening angles than the tubular microjets, indicating that the shape and geometry of the motors influence their chemotactic behavior. These differences are illustrated in Figure 4 where, upon increasing peroxide concentration, the mean deviation angle of both types of motors increases, with larger angles for the Janus particles for all concentrations. Also, the standard deviations are always larger for Janus motors than for tubular microjets. We attribute this variation to the difference in rotational diffusion caused by the different particle size/shape of the spherical particle (5 μm diameter) and tubular microjets (50 μm in length; Figure 5A). The fluid around the motors induces an interfacial drag force provoking the spherical particles to rotate more easily than the microtubes. Moreover, the catalytic sites preferably rotate around the symmetry axis of the micro-object, along their trajectory of motion and give rise to motions in different directions which in turn leads to larger standard deviations in the experiments. In contrast, the microtubes containing catalytic sites in their hollow interior, have three axes of symmetry with non-identical coefficients of rotational diffusion τR. Thus, motion of the microtubes is not so much affected by the fluid flowing around them and thus, their motion is straighter in nature over the investigated region where the chemical gradient is generated. The exact mechanism of enhanced diffusion of the tubular microjets towards the gradient of chemo-attractant is still not well understood.
Figure 3.
Statistical analyses of the opening-angle distributions for catalytic microtubes and Janus particles at different concentrations of hydrogen peroxide. Tubular microjets (A–C) and Janus motors histogram (D–F) for 5, 10, and 15% (wt./wt) H2O2 showing the average values. n represents the number of analyzed particles.
Figure 4.
Opening angle of catalytic micromotors in different concentrations of hydrogen peroxide solution injected by one of the microfluidic channels. Black plot Janus particles and red plot tubular microjets.
Figure 5.
Dynamics of spherical and microtubular micromotors (panel A is not in scale) when flowing into microfluidic channels in a chemotactic experiment. A) Rotational diffusion schemes. B) Spherical Janus motors deviating towards peroxide solution with catalytic sites (dark areas on the particles) facing different positions, C) microtubes deviate slightly towards peroxide with small angles. Red arrows indicate the direction of the micromotors. Yellow line in (B) visually separates the channels and the mixing area and red line in (C) marks the projection of the microchannels.
However, the phenomenon can be qualitatively described by assuming that, when the catalytic micromotors are immersed in a gradient of concentration of fuel and turn towards higher concentrations they make longer “runs” than if they turn towards lower concentration of fuel. Consequently, a net chemotactic displacement is observed. These results are in agreement with the observations from Sen and co-workers on chemotactic motion of self-propelled nanorods in bulk.[12]
The self-propelled micromotors are subject to Brownian diffusion, which is dependent on the size and symmetry.[19] The displacement of the particle is defined by the processes of the translational and rotational diffusion with coefficients: DT= kBT/6πηR0 and DR = kBT/8πηR03, respectively.[20] Where, kBT is the thermal energy, η is the viscosity of water, and R0 is the radius of the catalytic objects. The entering of the area containing fuel-molecules induces the local chemical reaction near the catalytic side of the micromotors. This leads to the enhancement of the fluctuations of the particles owing to the increase of the translational component of the diffusion similar to the results reported by Paxton et al. and Howse et al.[21]
However, the degree of deviation of both types of catalytic micromotors towards the higher concentrations of hydrogen peroxide is governed by the processes of rotational diffusion, which cause random reorientations of the catalytic object. The important parameter is the characteristic time of rotational diffusion τR = 1/DR = 8πηR03/kBT, which is very different for spherical Janus particles and tubular microjets when placed in water at T=300 K, that is, τRJanus≈102 s and τRTube≈105 s (along the long axis of the tube, length of the microtube is 50 μm), respectively. Furthermore, we found a trend of a nonlinear monotonic decrease of τR with an increase of concentration of H2O2 in solution, similar to that found by Howse et al. (data not shown).[21b] Subsequently, spherical Janus motors experience much stronger affinity to reorient within the gradient of hydrogen peroxide, compared to the tubular microjets. In addition, once the concentration of the peroxide increases, the difference in the chemotactic behavior (deviation towards higher fuel concentration, opening angle) of the spherical motors and tubular microjets becomes more visible. This fact is the direct consequence of the decrease of τR for the catalytic objects in the solution containing fuel.
In conclusion, we presented a controllable way of studying chemotactic behavior of two families of artificial catalytic micromotors, known to be driven by distinct mechanisms. Spherical Janus particles and tubular microjets move towards the gradient of fuel in microfluidic channels without the influence of capillary forces. The chemotactic motion was found to be dependent on the concentration of chemoattractant but also on the size and shape of the artificial micromotors. Different types of micromotors deviate in different angles, which could lead to possible applications, such as separation of objects at micron- and nanoscale. The chemotactic effect using microfluidics has been extensively studied in bio-organisms, such as bacteria. Herein, we presented an extension of that phenomenon into man-made micromotors, demonstrating that these can sense the environment and be directed towards desired locations. Further studies could lead to the understanding of collective behaviors of catalytic motors, the attraction or repulsion to other molecules rather than hydrogen peroxide, such pollutants in water.
Experimental Section
Preparation of tubular microjets: Catalytic tubular Ti/Pt microjets (Figure 1A (top left)) were prepared by rolling up nanomembranes from a photoresist. Square patterns with a width of 50 μm were prepared on 1.5 inch silicon wafers. Photoresist ARP 3510 was spin coated onto the silicon wafers at 3500 rpm for 35 s followed by a soft bake using a hotplate at 90°C for 1 min and exposure to UV light with a Karl Suss MA56 Mask Aligner (410–605 nm). Patterns were developed in AR300–35:H2O (1:1 v/v) solution. Using angular electron-beam deposition, 10 nm Ti layers were deposited on the photoresist patterns, followed by the magnetron sputtering of a 1 nm Pt layer. Microjets were rolled up by immersing the samples in acetone and dissolving the sacrificial photoresist layer.
Preparation of Janus particles (Figure 1A, (top right)) was carried out following standard procedures.[22] In this case, a suspension of silica colloidal particles, with diameter of 5 μm, was deposited onto a cleaned glass substrate. The monolayer was dried by slow evaporation of the solvent at room temperature. Thereafter, a thin bilayer of Pt (15 nm)/Ti (2 nm) was deposited on top of the spherical colloids using electron beam evaporation. The metal films form the semi-spherical “caps” on the surface of the particles. After fabrication, the Janus particles are detached from the substrate by sonication to form the dispersion for microfluidic experiments.
The fabrication of the microfluidic chips is by using a rapid prototyping of poly(dimethylsiloxane) (PDMS) based microfluidic chips. For that, a master stamp containing the inverse shaped microfluidic channel structure was prepared by spin coating a 30 μm thick layer of a negative photoresist SU-8 on a silicon substrate, treated and structured by using photolithography methods. The PDMS was prepared by mixing 10 mL of the PDMS base polymer and the curing agent in a ratio of 10:1 (volume) gently together and degasing it in a desiccator over 10 min at a pressure below 50 mbar. After baking the PDMS at 110°C on a hotplate and cooling down, the PDMS can be peeled off the casting mold. To achieve a permanent bonding between the prepared PDMS and a bare glass substrate, both were treated with oxygen plasma establishing a non-reversible bond between the two materials.
Software-controlled micropumps (NEMESYS from Cetony, Germany) were attached by flexible poly(tetraflourethylene) (PTFE) tubing to the microfluidic chip in order to pump the fluids in a well-controlled manner through the microfluidic structure.
CCD Camera was integrated into Zeiss Axio Microscope and videos were analyzed in ImageJ free imaging software.
Footnotes
This work was supported by Volkswagen Foundation (project number 86 362). S.S. thanks the European Research Council (ERC) for Starting Grant (LT-NRBS).
Supporting information for this article is available on the WWW under http://dx.doi.org/10.1002/anie.201301460.
Contributor Information
Dr. Larysa Baraban, Institute for Integrative Nanosciences, Leibniz Institute for Solid State and Materials Research Dresden Helmholtzstrasse 20, 01069 Dresden (Germany).
Dr. Stefan M. Harazim, Institute for Integrative Nanosciences, Leibniz Institute for Solid State and Materials Research Dresden Helmholtzstrasse 20, 01069 Dresden (Germany)
Dr. Samuel Sanchez, Institute for Integrative Nanosciences, Leibniz Institute for Solid State and Materials Research Dresden Helmholtzstrasse 20, 01069 Dresden (Germany).
Prof. Dr. Oliver G. Schmidt, Institute for Integrative Nanosciences, Leibniz Institute for Solid State and Materials Research Dresden Helmholtzstrasse 20, 01069 Dresden (Germany); Material Systems for Nanoelectronics Chemnitz University of Technology Reichenhainer Strasse 70, 09107 Chemnitz (Germany)
References
- [1].a) Adler J. Science. 1969;166:1588–1597. doi: 10.1126/science.166.3913.1588. [DOI] [PubMed] [Google Scholar]; b) Van Haastert PJM, Devreotes PN. Nat. Rev. Mol. Cell Biol. 2004;5:626–634. doi: 10.1038/nrm1435. [DOI] [PubMed] [Google Scholar]
- [2].Engelmann TW. Pfluegers Arch. Gesamte Physiol. Menschen Tiere. 1881;25:285–292. [Google Scholar]
- [3].Engelmann TW. Pfluegers Arch. Gesamte Physiol. Menschen Tiere. 1881;26:537–545. [Google Scholar]
- [4].a) Mallouk TE, Sen A. Sci. Am. 2009 May;:72–77. doi: 10.1038/scientificamerican0509-72. [DOI] [PubMed] [Google Scholar]; b) Wang J. ACS Nano. 2009;3:4–9. doi: 10.1021/nn800829k. [DOI] [PubMed] [Google Scholar]; c) Ozin GA, Manners I, Fournier-Bidoz S, Arsenault A. Adv. Mater. 2005;17:3011–3018. [Google Scholar]; d) Sengupta S, Ibele ME, Sen A. Angew. Chem. 2012;124:8560–8571. doi: 10.1002/anie.201202044. [DOI] [PubMed] [Google Scholar]; Angew. Chem. Int. Ed. 2012;51:8434–8445. doi: 10.1002/anie.201202044. [DOI] [PubMed] [Google Scholar]; e) Sánchez S, Pumera M. Chem. Asian J. 2009;4:1402–1410. doi: 10.1002/asia.200900143. [DOI] [PubMed] [Google Scholar]; f) Pumera M. Chem. Commun. 2011;47:5671–5680. doi: 10.1039/c1cc11060h. [DOI] [PubMed] [Google Scholar]
- [5].a) Ghosh A, Fischer P. Nano Lett. 2009;9:2243–2245. doi: 10.1021/nl900186w. [DOI] [PubMed] [Google Scholar]; b) Solovev AA, Sanchez S, Pumera M, Mei YF, Schmidt OG. Adv. Funct. Mater. 2010;20:2430–2435. [Google Scholar]; c) Kline TR, Paxton WF, Mallouk TE, Sen A. Angew. Chem. 2005;117:754–756. doi: 10.1002/anie.200461890. [DOI] [PubMed] [Google Scholar]; Angew. Chem. Int. Ed. 2005;44:744–746. doi: 10.1002/anie.200461890. [DOI] [PubMed] [Google Scholar]; d) Tottori S, Zhang L, Qiu F, Krawczyk KK, Franco-Obregón A, Nelson BJ. Adv. Mater. 2012;24:811–816. doi: 10.1002/adma.201103818. [DOI] [PubMed] [Google Scholar]; e) Zhang L, Abbott JJ, Dong LX, Kratochvil BE, Bell D, Nelson BJ. Appl. Phys. Lett. 2009;94:064107. [Google Scholar]; f) Nelson BJ, Kaliakatsos IK, Abbott JJ. Annu. Rev. Biomed. Eng. 2010;12:55–85. doi: 10.1146/annurev-bioeng-010510-103409. [DOI] [PubMed] [Google Scholar]; g) Sanchez S, Solovev AA, Schulze S, Schmidt OG. Chem. Commun. 2011;47:698–700. doi: 10.1039/c0cc04126b. [DOI] [PubMed] [Google Scholar]; h) Baraban L, Makarov D, Streubel R, Mönch I, Grimm D, Sanchez S, Schmidt OG. ACS Nano. 2012;6:3383–3389. doi: 10.1021/nn300413p. [DOI] [PubMed] [Google Scholar]; i) Solovev AA, Xi W, Ananth AN, Gracias DH, Sanchez S, Schmidt OG. Nanoscale. 2013;4:1294–1297. doi: 10.1039/c2nr32798h. [DOI] [PMC free article] [PubMed] [Google Scholar]; j) Peyer KE, Zhang L, Nelson BJ. Nanoscale. 2013;5:1259–1272. doi: 10.1039/c2nr32554c. [DOI] [PubMed] [Google Scholar]; k) Baraban L, Makarov D, Schmidt OG, Cuniberti G, Leiderer P, Erbe A. Nanoscale. 2013;5:1332–1336. doi: 10.1039/c2nr32662k. [DOI] [PubMed] [Google Scholar]
- [6].a) Ibele M, Mallouk TE, Sen A. Angew. Chem. 2009;121:3358–3362. doi: 10.1002/anie.200804704. [DOI] [PubMed] [Google Scholar]; Angew. Chem. Int. Ed. 2009;48:3308–3312. doi: 10.1002/anie.200804704. [DOI] [PubMed] [Google Scholar]; b) Solovev AA, Smith EJ, Bufon CCB, Sanchez S, Schmidt OG. Angew. Chem. 2011;123:11067–11070. [Google Scholar]; Angew. Chem. Int. Ed. 2011;50:10875–10878. doi: 10.1002/anie.201102096. [DOI] [PubMed] [Google Scholar]
- [7].a) Balasubramanian S, Kagan D, Manesh KM, Calvo-Marzal P, Flechsig GU, Wang J. Small. 2009;5:1569–1574. doi: 10.1002/smll.200900023. [DOI] [PubMed] [Google Scholar]; b) Sanchez S, Ananth AN, Fomin VM, Viehrig M, Schmidt OG. J. Am. Chem. Soc. 2011;133:14860–14863. doi: 10.1021/ja205012j. [DOI] [PubMed] [Google Scholar]; c) Baraban L, Streubel R, Makarov D, Han L, Karnaushenko D, Schmidt OG, Cuniberti G. ACS Nano. 2013;7:1360–1367. doi: 10.1021/nn305726m. [DOI] [PubMed] [Google Scholar]
- [8].a) Calvo-Marzal P, Manesh KM, Kagan D, Balasubramanian S, Cardona M, Flechsig GU, Posner J, Wang J. Chem. Commun. 2009:4509–4511. doi: 10.1039/b909227g. [DOI] [PubMed] [Google Scholar]; b) Loget G, Kuhn A. Nat. Commun. 2011;2 doi: 10.1038/ncomms1550. DOI: 10.1038/ncomms1550. [DOI] [PubMed] [Google Scholar]
- [9].a) Wang J, Gao W. ACS Nano. 2012;6:5745–5751. doi: 10.1021/nn3028997. [DOI] [PubMed] [Google Scholar]; b) Wang W, Castro LA, Hoyos M, Mallouk TE. ACS Nano. 2012;6:6122–6132. doi: 10.1021/nn301312z. [DOI] [PubMed] [Google Scholar]
- [10].a) Yu H, Jo K, Kounovsky KL, de Pablo JJ, Schwartz DC. J. Am. Chem. Soc. 2009;131:5722. doi: 10.1021/ja900372m. [DOI] [PMC free article] [PubMed] [Google Scholar]; b) Sengupta S, Dey KK, Muddana HS, Tabouillot T, Ibele ME, Butler PJ, Sen A. J. Am. Chem. Soc. 2013;135:1406–1414. doi: 10.1021/ja3091615. [DOI] [PubMed] [Google Scholar]
- [11].Pavlick RA, Sengupta S, McFadden T, Zhang H, Sen A. Angew. Chem. 2011;123:9546–9549. doi: 10.1002/anie.201103565. [DOI] [PubMed] [Google Scholar]; Angew. Chem. Int. Ed. 2011;50:9374–9377. doi: 10.1002/anie.201103565. [DOI] [PubMed] [Google Scholar]
- [12].Hong Y, Blackman NMK, Kopp ND, Sen A, Velegol D. Phys. Rev. Lett. 2007;99:178103. doi: 10.1103/PhysRevLett.99.178103. [DOI] [PubMed] [Google Scholar]
- [13].Pfeffer W. Unters. Bot. Inst. Tübingen. 1884;1:363–482. [Google Scholar]
- [14].Solovev AA, Mei YF, Schmidt OG. Adv. Mater. 2010;22:4340–4344. doi: 10.1002/adma.201001468. [DOI] [PubMed] [Google Scholar]
- [15].Berg HC. Nature. 1975;254:389–392. doi: 10.1038/254389a0. [DOI] [PubMed] [Google Scholar]
- [16].Mei YF, Solovev AA, Sanchez S, Schmidt OG. Chem. Soc. Rev. 2011;40:2109–2119. doi: 10.1039/c0cs00078g. [DOI] [PubMed] [Google Scholar]
- [17].Mao HB, Cremer PS, Manson MD. Proc. Natl. Acad. Sci. USA. 2003;100:5449–5454. doi: 10.1073/pnas.0931258100. [DOI] [PMC free article] [PubMed] [Google Scholar]
- [18].a) Jeon NL, Baskaran H, Dertinger SKW, Whitesides GM, Van de Water L, Toner M. Nat. Biotechnol. 2002;20:826–830. doi: 10.1038/nbt712. [DOI] [PubMed] [Google Scholar]; b) Ahmed T, Shimizu TS, Stocker R. Integr. Biol. 2010;2:604–629. doi: 10.1039/c0ib00049c. [DOI] [PubMed] [Google Scholar]
- [19].Ebbens S, Tu MH, Howse JR, Golestanian R. Phys. Rev. E. 2012;85:020401. doi: 10.1103/PhysRevE.85.020401. [DOI] [PubMed] [Google Scholar]
- [20].Dhont J. An introduction to dynamics of colloids. Elsevier; Amsterdam: 1996. [Google Scholar]
- [21].a) Paxton WF, Sen A, Mallouk TE. Chem. Eur. J. 2005;11:6462–6470. doi: 10.1002/chem.200500167. [DOI] [PubMed] [Google Scholar]; b) Howse JR, Jones RAL, Ryan AJ, Gough T, Vafabakhsh R, Golestanian R. Phys. Rev. Lett. 2007;99:048102. doi: 10.1103/PhysRevLett.99.048102. [DOI] [PubMed] [Google Scholar]
- [22].Jiang S, Chen Q, Tripathy M, Luijten E, Schweizer KS, Granick S. Adv. Mater. 2010;22:1060–1071. doi: 10.1002/adma.200904094. [DOI] [PubMed] [Google Scholar]


