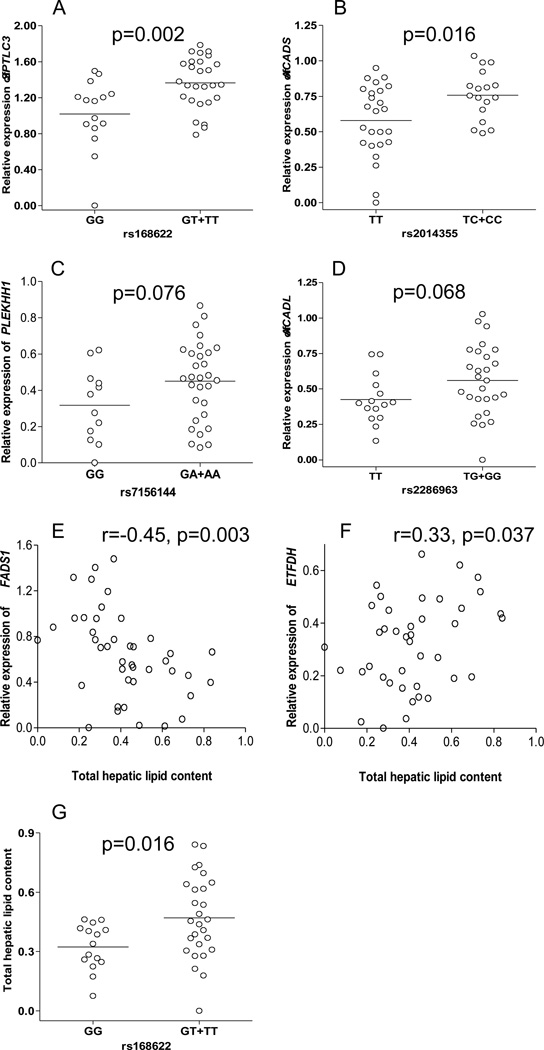
Figure 1. Correlations between SNPs, mRNA and hepatic lipid content (HLC) in liver tissue.
A) rs168622 and SPTLC3; B) rs2014355 and ACADS; C) rs7156144 and PLEKHH1; D) rs2286963 and ACADL; E) FADS1 and HLC; F) ETFDH and HLC; and G) rs168622 and HLC. HLC and all gene expression data (ratio between each gene and the internal control TBP gene) were log transformed (+log10).

