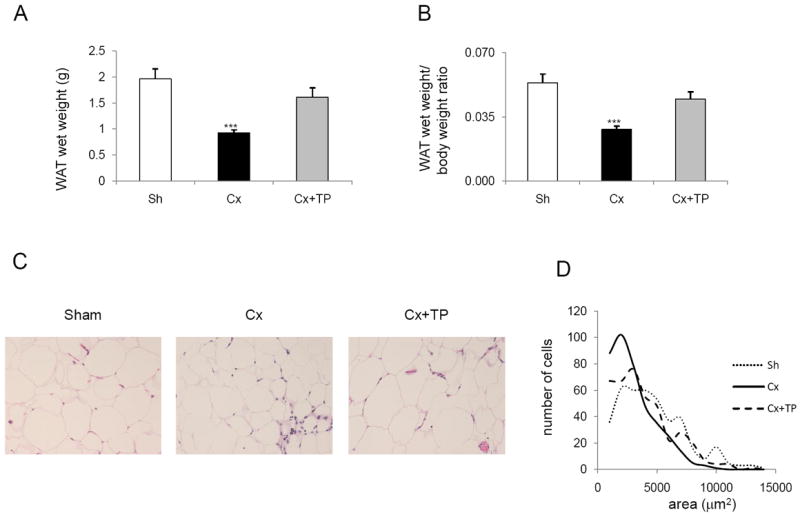
Fig. 2.

The high-fat diet group: (A) WAT wet weight, (B) WAT wet weight/body weight ratio, (C) hematoxylin and eosin staining of WAT, and (D) the adipocyte size distribution. (A) C57BL/6J mice fed with high-fat diet were sham-operated, castrated, and castrated and treated with testosterone pellets as described in Materials and Methods. At the end of the experiment, mice were euthanized and their WAT wet weights and body weights were recorded. Columns, WAT wet weight; bars, SE; **p < 0.01; ***p < 0.001. (B) The WAT wet weight/body weight ratio was calculated. Columns, WAT wet weight/body weight ratio; bars, SE; ***p < 0.001. (C) Hematoxylin and eosin staining of WAT from sham-operated, castrated, and castrated + TP mice was performed as described in Materials and Methods. Original magnification, 10×. (D) Line-graphs represent the adipocyte size distribution which was acquired by the image analyses. For each experimental group 500 adipocytes were randomly selected from 5 specimens and the areas of individual adipocytes were measured. Histogram function was used; bins were selected as 1,000 μm2 increments).
