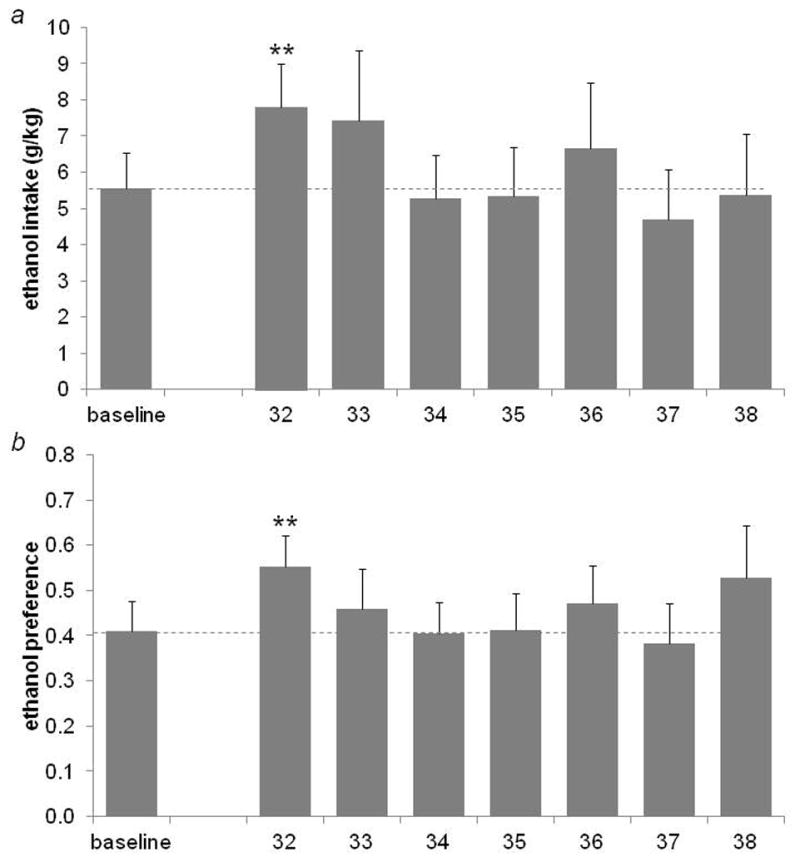
Figure 2.

Ethanol intake (a) and preference (b) for pre-deprivation baseline and post-deprivation days in Experiment II. Both intake and preference were significantly increased on the first day following deprivation (**p<0.007), but did not differ from baseline on any other post-deprivation days (p>0.17 for all comparisons). Dotted line represents the baseline mean.
