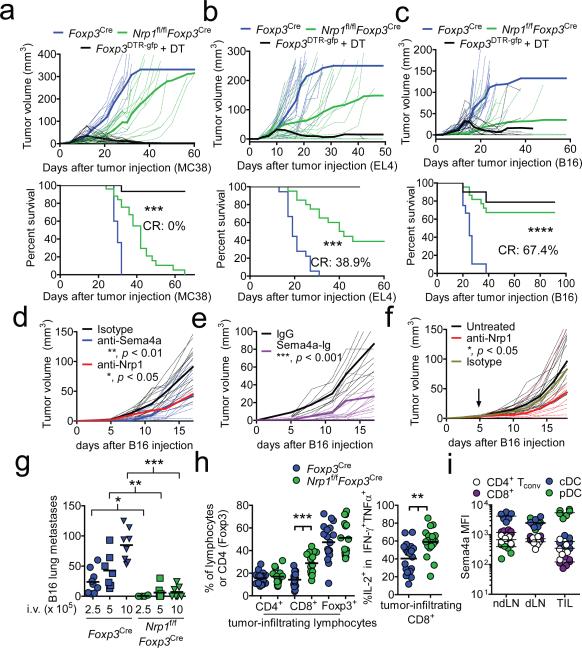
Figure 2. Nrp1-deficient Treg fail to suppress antitumor immune responses.
a, Tumor growth curve (top) and survival plot (bottom) of Foxp3Cre, Nrp1f/fFoxp3Cre, or Foxp3DTR.gfp mice receiving 1.25 × 10⁵ MC38 melanoma cells s.c. and (for Foxp3DTR.gfp) 100 μg diphtheria toxin (DT) i.p. twice weekly. b, As in a, but mice received 1.25 × 10⁵ EL4 thymoma i.d. c, As in a, but mice received 1.25 × 10⁵ B16 melanoma i.d. d, Tumor growth curve of C57/BL6 mice receiving 1.25 × 10⁵ B16 melanoma i.d. concomitant with injections of isotype control, anti-Sema4a, or anti-Nrp1 (100 μg) twice weekly. e, Tumor growth curve as in d except mice received Sema4a-Ig twice weekly. f, Tumor growth curve of C57/BL6 mice receiving 1.25 × 10⁵ B16 melanoma i.d. When tumors were palpable (day 5, indicated by arrow), mice began receiving injections of anti-Nrp1 or its isotype control (400 μg initially, 200 μg every 3 d). g, Lung metastasis counts from Foxp3Cre or Nrp1f/fFoxp3Cre mice injected with 2.5-10 × 105 B16 cells i.v. 17-20 d earlier. h, Tabulation of flow cytometric analysis of tumor-infiltrating lymphocytes from Foxp3Cre or Nrp1f/fFoxp3Cre mice injected i.d. with B16 18 d earlier. i, Sema4a expression of various immune cells in ndLN, dLN, or TIL. Results represent the mean of five (a-c, n=10-25 mice), three (d-h n=8-20 mice), or three (i) experiments. *, p < 0.05, **, p < 0.01, ***, p < 0.001, by (a-f) one-way ANOVA or (g-i) unpaired t-test. Error bars indicate s.e.m.

