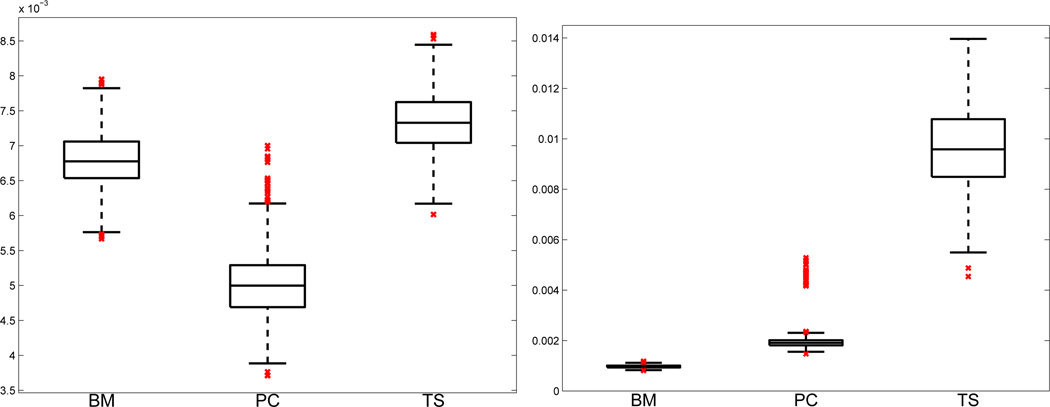
Figure 2.
Boxplots of the square roots of average squared errors (RASE) for the estimated dynamic process, ĝ(t, z), and the PDE modeling errors, ℱ̂{ĝ(t, z); θ̂}, using the Bayesian method (BM), the parameter cascading method (PC), and the two-stage method (TS) from 1000 data sets in the simulation study. Left: boxplots of RASE(ĝ), defined in (15), by all three methods. Right: boxplots of RASE(ℱ̂), defined in (16), by all three methods.

