
Figure 1.
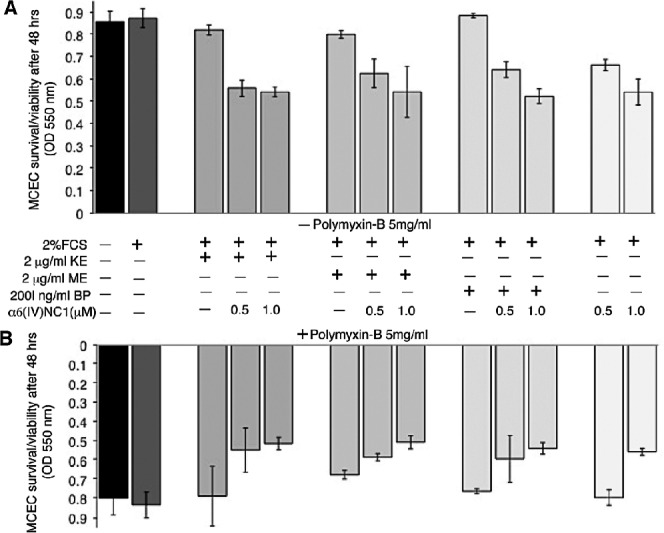
Inhibition of MCEC survival by α6(IV)NC1. (A) Upper graph showing survival of MCECs without polymyxin-B treatments. (B) Lower graph showing MCECs treated with polymyxin-B. Status bars indicate average cell survival of MCECs (mean ± SD of 3 replicates) after 48 hours of treatment. Presence (+) and absence (−) of factor in respective treatments are indicated.