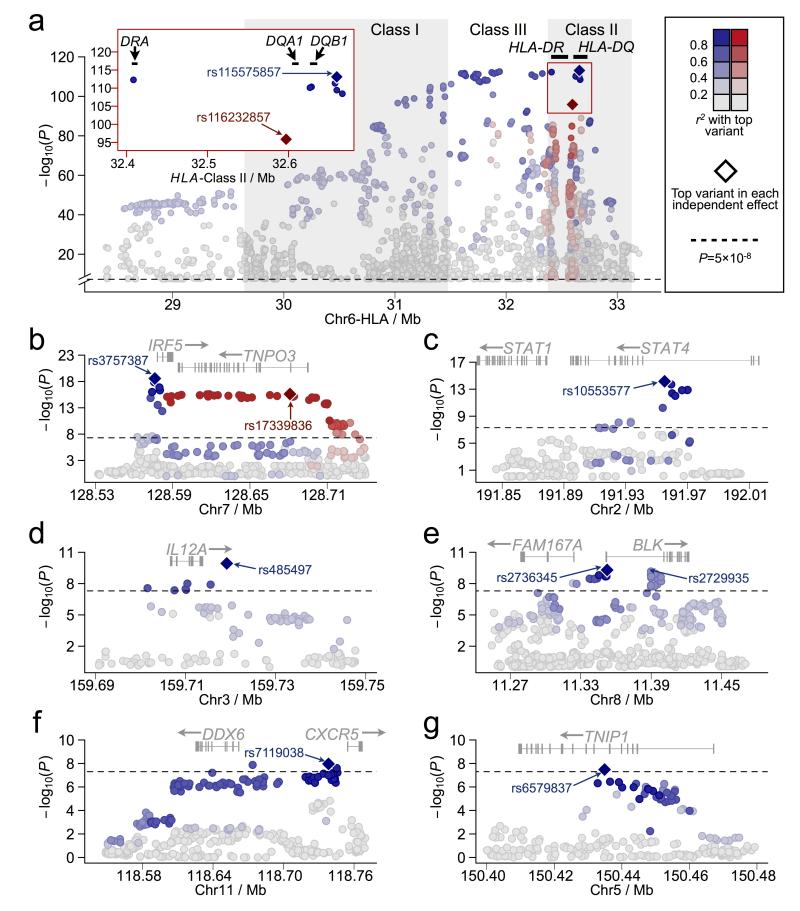
Figure 2.
Zoomed in plots of the meta-analysis results for the seven regions with Pmeta<5×10⁻⁸. The HLA region (a) from Mb 28.4 to Mb 33.4 is shown for variants with Pmeta<5×10⁻⁸ only. Strong linkage disequilibrium (LD) was observed with variants extending from Class I through Class II (pairwise LD with rs115575857 is given in blue). A second independent effect was identified in Class II peaking at rs116232857 (pairwise LD is depicted in red). The red insert on the left shows a further zoomed in view of the top associated variants in the Class II region. (b) The area of association surrounding IRF5 is shown, including the pairwise LD with the top overall variant, rs3757387, in blue. Pairwise LD with the top SNP, rs17339836, in the second effect is shown in red. STAT4 (c), IL12A (d), BLK (e), CXCR5 (f) and TNIP1 (g) regions are also provided and include pairwise LD with the top listed variant shown in blue. The black dashed lines represent Pmeta = 5×10⁻⁸.

