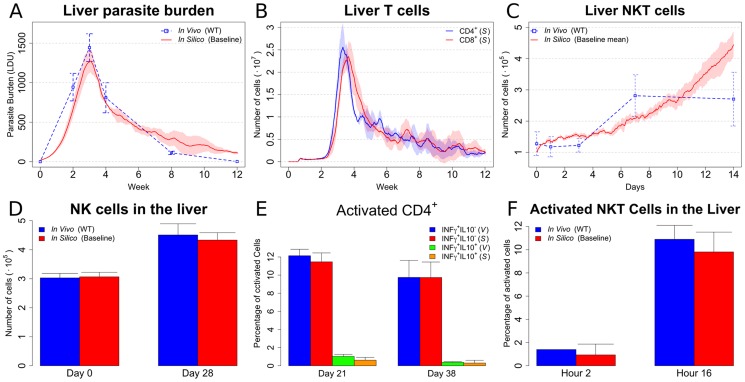
Figure 2. Baseline model reproduces many biological features of EVL.
In all the panels, means and standard deviation are reported. Standard deviation is indicated by error bars or shaded areas (A) Organ level parasite burden (compared with [58]). (B) Number of CD4+ and CD8+ T cells over the course of infection of in silico data. The same plotting convention as panel A is used. (C) Number of NKT cells (compared with [59]). The same plotting conventions are used as in panel A. (D) NK cell number (compared with [29]). (E) Percentage of activated CD4+ T cells (compared with unpublished data). (V) and (S) indicate in vivo and in silico, respectively. (F) Percentage of activated NKT cells (compared with [59] and [60]).

