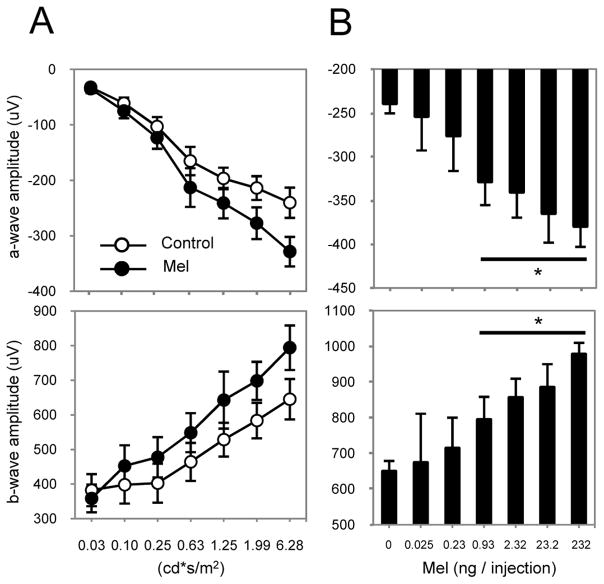
Figure 5. Dose-response to intravitreal injection of melatonin.
(A) Quantification of the dark-adapted response of the a- (upper panel) and b-wave (lower panel) to flashes of light recorded after 1 h of dark adaptation and intravitreal injection of melatonin or vehicle in C3H-f+/+ mice. Intravitreal injection of melatonin (0.93 ng) induced a significant increase of the a- and b-wave amplitude (two-way ANOVA, P < 0.001). (B) Quantification of the dark-adapted response of the a- (upper panel) and b-wave (lower panel) to different doses of melatonin injected intravitreally. Intravitreal injection of melatonin induced an increase in the amplitude of the a- and b-wave in a dose-dependent manner. Data are presented as mean ± SEM; n = 5–8 for each group. Luminance is expressed in candela-seconds per meter squared (cd*s/m2). ERGs in this experiment were performed at ZT 6. * denotes P < 0.05 with respect to vehicle injection (t-tests).

