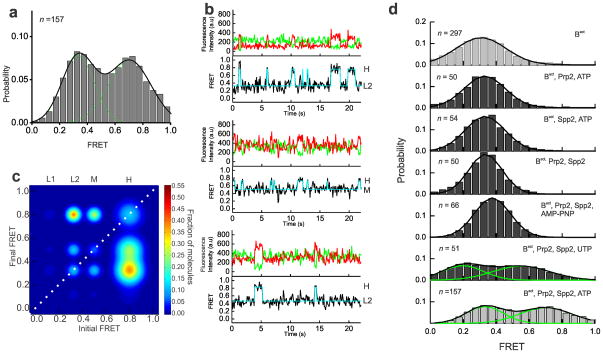
Figure 3.
Upon the addition of ATP, Prp2 and Spp2, the pre-mRNA is able to explore splice site proximity. (a) FRET probability distribution of the raw single molecule FRET trajectories upon the addition of Prp2, Spp2, and ATP to the Bact complex, leading to formation of the B* complex. (b) Representative single molecule FRET time trajectories from the B* condition with the raw donor (Cy3, green), acceptor (Cy5, red), FRET (black) trajectories, and idealized HMM models (cyan). (c) TODP generated from the idealized HMM for molecules in the B* condition. L1, L2, M, or H refers to the four states resulting from clustering analysis. (d) FRET probability densities generated from molecules in Bact incubated with various combinations of components required for formation of B* (Prp2, Spp2, and ATP). In addition, Bact was incubated with Prp2, Spp2, and one of two NTP analogs, non-hydrolysable AMP-PNP or UTP.

