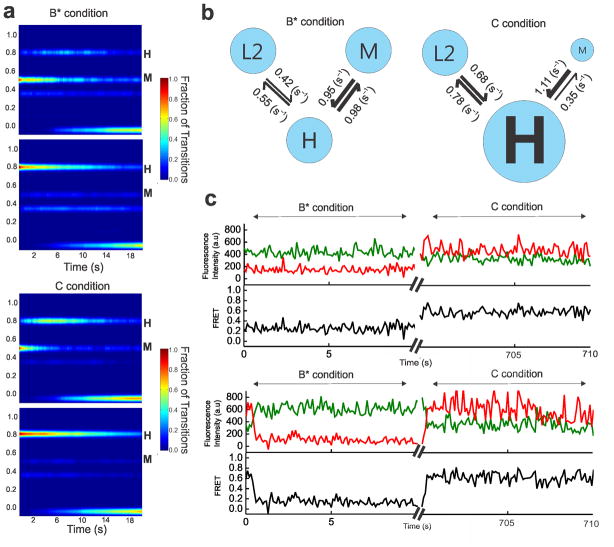
Figure 5.
Cwc25 enhances the first step of splicing by stabilizing the H state. (a) A comparison of the aggregate molecular behavior before (B* condition) and after (C condition) Cwc25 addition through post-synchronized histograms (PSH) with all trajectories synchronized to start from either the M (top) or H state (bottom). (b) A comparison of the rate constants of the observable transitions under B* and C conditions. The thickness of arrows corresponds to the relative rate constants. (c) Representative single molecule FRET trajectories showing transition dynamics from the same molecules imaged before (B* condition) and after (C condition) Cwc25 addition with the raw donor (Cy3, green), acceptor (Cy5, red), and FRET (black) trajectories. The axis breaks represent 10 min of incubation after Cwc25 addition.

