Figure 1.
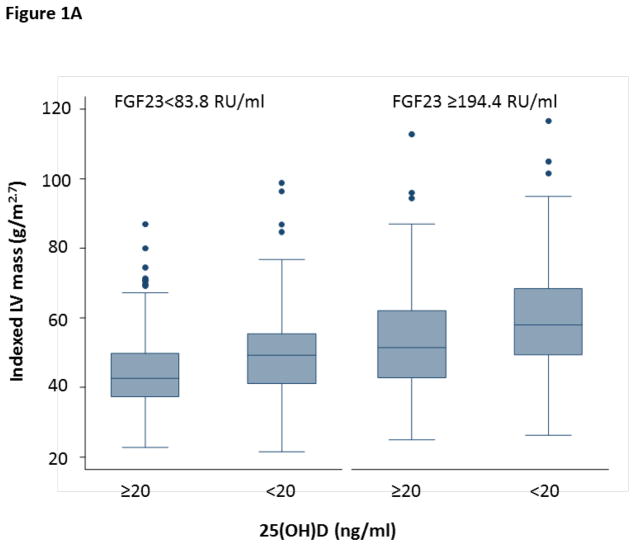
Figure 1A. The Effects of 25(OH)D Deficiency on LV Mass are More Pronounced with High FGF23
This graph displays the median and interquartile ranges for LV mass according to 25(OH)D Deficiency and the 25th and 75th percentile levels of FGF23
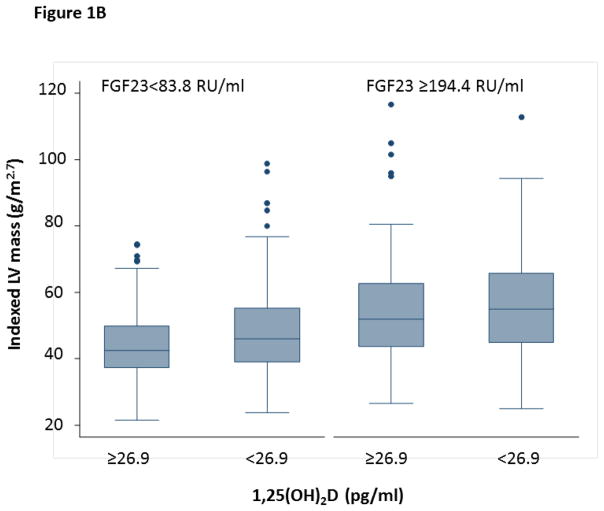
Figure 1B. The Effects of Low 1,25(OH)2D on LV Mass are More Pronounced with High FGF23
This graph displays the median and interquartile ranges for LV mass according to median percentile cutpoints for 1,25(OH)2D and the 25th and 75th percentile levels of FGF23


