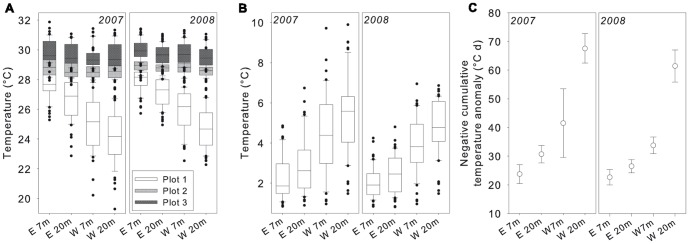
Figure 4. Temperature data for all Similan Islands sites.

Central tendency box plots (median with 25th and 75th percentile and non-outlier range) with extremes (dots) (A, B) and scatter plots with standard deviation (SD, whiskers) for the study periods [Feb 2007 to Feb 2008 (2007) and Nov 2007 to Nov 2008 (2008)], sides (east, E and west, W) and depths (7 and 20 m), featuring overall monthly minimum, mode and maximum temperatures (A), monthly temperature ranges (B), and negative cumulative temperature anomalies (calculated as degree days, °C d; calculation details see methods) (C).
