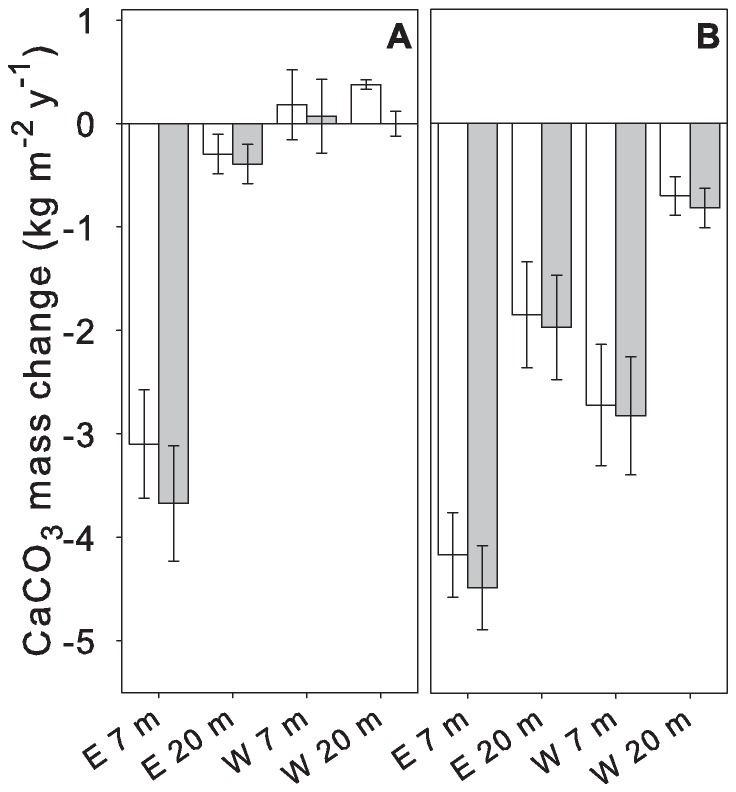
Figure 6. Calcium carbonate (CaCO3) mass change accretion (>0) and bioerosion (<0).
Measured mass change (white columns) and calculated mass change (grey columns, corrected for accretion due to fouling organisms) of CaCO3 blocks at east (E) and west (W) side of Similan island Ko Miang. Error bars: ±1 SE of mean. Results from 12 months exposure (February 2007 to February 2008) (A), and 21 months exposure (February 2007 to November 2008) (B) normalized to 1 year (number of replicates in each case: 9).

